 RSS Feed
 by Calculated Risk on 4/30/2010 04:44:00 PM
Friday, April 30, 2010
Bank Failures #58 to 60: Puerto Rico
Los prestamos dudosos
Peo gestion
by Soylent Green is People
From the FDIC: Oriental Bank and Trust, San Juan, Puerto Rico, Assumes All of the Deposits of Eurobank, San Juan, Puerto Rico
Eurobank, San Juan, Puerto Rico, was closed today by the Office of the Commissioner of Financial Institutions of the Commonwealth of Puerto Rico, which appointed the Federal Deposit Insurance Corporation (FDIC) as receiver. ...From the FDIC: Scotiabank de Puerto Rico, San Juan, Puerto Rico, Assumes All of the Deposits of R-G Premier Bank of Puerto Rico, Hato Rey, Puerto Rico
As of December 31, 2009, Eurobank had approximately $2.56 billion in total assets and $1.97 billion in total deposits. ...
The FDIC estimates that the cost to the Deposit Insurance Fund (DIF) will be $743.9 million. ... Eurobank is the 58th FDIC-insured institution to fail in the nation this year. Eurobank is one of three institutions closed in Puerto Rico today.
R-G Premier Bank of Puerto Rico, Hato Rey, Puerto Rico, was closed today by the Office of the Commissioner of Financial Institutions of the Commonwealth of Puerto Rico, which appointed the Federal Deposit Insurance Corporation (FDIC) as receiver. ...From the FDIC: Banco Popular de Puerto Rico, San Juan, Puerto Rico, Assumes All of the Deposits of Westernbank Puerto Rico, Mayaguez, Puerto Rico
As of December 31, 2009, R-G Premier Bank of Puerto Rico had approximately $5.92 billion in total assets and $4.25 billion in total deposits. ...
The FDIC estimates that the cost to the Deposit Insurance Fund (DIF) will be $1.23 billion.... R-G Premier Bank of Puerto Rico is the 59th FDIC-insured institution to fail in the nation this year. R-G Premier Bank of Puerto Rico is one of three institutions closed in Puerto Rico today.
Westernbank Puerto Rico, Mayaguez, Puerto Rico, was closed today by the Office of the Commissioner of Financial Institutions of the Commonwealth of Puerto Rico, which appointed the Federal Deposit Insurance Corporation (FDIC) as receiver. ...There goes a quick $5+ billion from the DIF ...
As of December 31, 2009, Westernbank Puerto Rico had approximately $11.94 billion in total assets and $8.62 billion in total deposits...
The FDIC estimates that the cost to the Deposit Insurance Fund (DIF) will be $3.31 billion. ... Westernbank Puerto Rico is the 60th FDIC-insured institution to fail in the nation this year. Western Bank was one of three institutions closed in Puerto Rico today.
Market Update, Goldman, and Housing Tax Credit expires
by Calculated Risk on 4/30/2010 04:00:00 PM
First, housing economist Tom Lawler will be on CNBC around 4:15 PM ET with Maria Bartoromo to discuss the expiration of the housing tax credit.
Second, Goldman is having a bad day, from Dow Jones: Goldman Sachs Shares, Bonds Slide On Criminal Probe
The stock has slumped more than 20% since the Securities and Exchange Commission filed civil securities-fraud charges against the company two weeks ago. Analystssaid they see little near-term upside for the shares. The Wall Street Journal's report late Thursday that the Justice Department is conducting a criminal investigation into whether Goldman or its employees committed securities fraud in connection with mortgage trading pushed the stock down ...Goldman is off almost 10% today.
 Click on graph for larger image in new window.
And from Doug Short:
This graph from Doug is titled: "Four Bad Bears".
Note that the Great Depression crash is based on the DOW; the three others are for the S&P 500.
Restaurant Index shows Expansion in March
by Calculated Risk on 4/30/2010 02:41:00 PM
This is one of several industry specific indexes I track each month.  Click on graph for larger image in new window.
This is the first time in 29 months that the index is showing expansion.
Unfortunately the data for this index only goes back to 2002.
Note: Any reading above 100 shows expansion for this index.
From the National Restaurant Association (NRA): Restaurant Industry Outlook Continues to Improve as Restaurant Performance Index Tops 100 for the First Time in More Than Two Years
[T]the National Restaurant Association’s Restaurant Performance Index (RPI) ... stood at 100.5 in March, up 1.4 percent from February and its strongest level since September 2007. In addition, the RPI rose above 100 for the first time in 29 months, which signifies expansion in the index of key industry indicators.Restaurants are a discretionary expense, and they tend to be 'first in, last out' of a recession for consumer spending (as opposed to housing that is usually first in and first out).
The RPI’s solid performance in March was driven by improvements among both the current-situation and forward-looking indicators,” said Hudson Riehle, senior vice president of the Research and Knowledge Group for the Association. “Restaurant operators reported net gains in both same-store sales and customer traffic in March, the first time in 31 months that both indicators stood in positive territory.”
“In addition, restaurant operators are increasingly optimistic about growth in sales and staffing levels in the months ahead, while their outlook for the economy soared to its strongest level in five years,” Riehle added.
...
For the first time in 22 months, restaurant operators reported net positive same-store sales.
...
Restaurant operators also reported a net increase in customer traffic in March, the first positive reading in 31 months.
emphasis added
A few comments on Q1 GDP Report
by Calculated Risk on 4/30/2010 11:59:00 AM
The change in private inventories was smaller this quarter - adding 1.7% to GDP in Q1 2010 compared to 4.4% in Q4 2009. It is important to note that the inventory contribution to Q4 GDP was from a slowdown in the liquidation of inventories, but in Q1 businesses were building inventories - and this inventory build will probably slow in Q2.
As I noted earlier, the two leading sectors, residential investment (RI) and personal consumption expenditures (PCE), were mixed. RI declined to a new record low as percent of GDP, however PCE increased at a 3.6% real annualized rate.
The increase in PCE does not seem sustainable unless employment and incomes increase soon. A large portion of the increase in PCE came from a decrease in personal saving.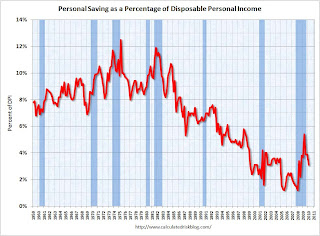 Click on graph for larger image in new window.
This graph shows personal saving as a percent of disposable personal income.
It is not unusual for the saving rate to decline at the beginning of a recovery as people become more confident. This helps drive consumer spending, but with the high levels of household debt, I expect the saving rate to increase over the rest of the year.
Here are some Q1 numbers (all annualized):
So the boost in PCE came from the decline in saving and the increase in benefits. That is not sustainable.
 The second graph shows real personal income less transfer payments as a percent of the previous peak.
Unlike the recovery in GDP, real personal income less transfer payments has barely increased and is still 6.6% below the pre-recession level.
The peak of the stimulus spending is in Q2 2010 (right now), and then the stimulus spending starts to taper off in the 2nd half of 2010. So underlying demand better increase soon - and that means jobs and incomes going forward.
Unfortunately residential investment is usually one of the key engines for employment and growth at the beginning of a recovery - and I expect RI to be sluggish all year because of the huge overhang of existing housing units. So my guess is the recovery will probably remain sluggish, and I still expect a slowdown in the 2nd half of 2010.
Thursday, April 29, 2010
Misc: "99ers", Puerto Rico and Goldman
by Calculated Risk on 4/29/2010 09:05:00 PM
Three followup stories ...
From Alana Semuels at the LA Times: '99ers' dread future without jobless benefits
In California, state officials estimate there are nearly 100,000 people who are still looking for work but can no longer draw an unemployment check. Federal labor officials could not provide a number nationally, but private-sector experts say it could easily top 1 million.From Eric Dash at the NY Times: Puerto Rican Lenders Face Their Own Crisis
What is certain is that, as the jobless rate remains stubbornly high, more Americans will have to face the challenge of making ends meet without a monthly check.
"People are going off a cliff and we're not really doing anything about it," said Andrew Stettner, deputy director of the National Employment Law Project.
At least three of Puerto Rico’s banks — Eurobank, R-G Premier Bank and Westernbank — are operating under cease-and-desist orders from regulators ...And from Susan Pulliam and Evan Perez at the WSJ: Criminal Probe Looks Into Goldman Trading . No real details, but earlier the NY Post reported that Goldman "may soon settle its [civil] fraud case".
Now that the deadline has come and gone, regulators have been working on a confidential plan to auction off the lenders ... It is known as Project Themis ... the efforts could cost the F.D.I.C. insurance fund as much as $5 billion, some analysts estimate.
And Q1 2010 GDP will be released in the morning. Consensus is for 3.4% annualized real GDP growth, but the details will be important.
Greece Agrees to Austerity Plan
by Calculated Risk on 4/29/2010 05:44:00 PM
From the Financial Times: Greece agrees €24bn austerity package
Greece has agreed the outline of a €24bn austerity package, including a three-year wage freeze for public sector workers, in return for a multibillion-euro loan from the eurozone and the International Monetary Fund ...The final details are still being worked out, but apparently the value-added tax (VAT) will be increased, public sector workers will lose their two large bonuses, and the retirement age will be increased significantly among other measures. This is intended to reduce the budget deficit by 10+ percentage points over 3 years.
except with permission
From the NY Times: Europe Moves Swiftly on Greek Rescue Plan
European leaders raced on Thursday to complete their part of a long-delayed financial rescue package for Greece, hoping to head off a chain reaction against other heavily indebted European nations that could turn into a financial meltdown across the continent.People have been comparing Greece to Lehman, but maybe a better comparison would be to Morgan Stanley (the bank everyone thought was next before TARP). This might be the beginning of the European sovereign TARP.
Unemployment: Many Workers exhausting all benefits
by Calculated Risk on 4/29/2010 03:23:00 PM
From Bloomberg: More Than a Million in U.S. May Lose Jobless Benefits (ht Chris)
[Lawmakers] are quietly drawing the line at 99 weeks of aid, a mark that hundreds of thousands of Americans have already reached. In coming months, the number of those who will receive their final government check is projected to top 1 million.According to the BLS, a record 6.5 million workers have been unemployed for 27 weeks or more. The article notes a study by the Pew Fiscal Analysis Initiative that shows 3.4 million workers have been unemployed for more than a year.
...
Interviews with state officials found that in New York, 57,000 people have received their last check. In Florida, 130,000 are no longer eligible as are about 30,000 Ohioans.
Not all states have 99 weeks of benefits, but some workers are starting to exhaust all of their benefits.
The job market better pickup soon ...
Hotel Occupancy increases 2.4% compared to same week in 2009
by Calculated Risk on 4/29/2010 12:08:00 PM
From HotelNewsNow.com: STR: Occupancy buoys chain scales' weekly results
Overall, the industry’s occupancy increased 2.4 percent to 60.7 percent, average daily rate dropped 2.4 percent to US$98.16, and RevPAR ended virtually flat with a 0.1-percent decrease to US$59.55.The following graph shows the occupancy rate by week and the 52 week rolling average since 2000.
 Click on graph for larger image in new window.
Notes: the scale doesn't start at zero to better show the change.
The graph shows the distinct seasonal pattern for the occupancy rate; higher in the summer because of leisure/vacation travel, and lower on certain holidays.
The occupancy rate is running slightly above 2009 - the worst year since the Depression - but still well below the normal level of close to 65% for this week.
Data Source: Smith Travel Research, Courtesy of HotelNewsNow.com
Chicago Fed: Economic Activity increased in March, Still below Trend
by Calculated Risk on 4/29/2010 09:40:00 AM
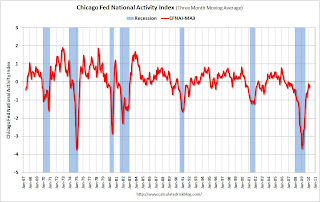
Note: This is a composite index based on a number of economic releases.
From the Chicago Fed: Index shows economic activity improved in March
Led by improvements in production- and employment-related indicators, the Chicago Fed National Activity Index increased to –0.07 in March, up from –0.44 in February. Three of the four broad categories of indicators that make up the index made positive contributions in March, while the consumption and housing category made the lone negative contribution.
The index’s three-month moving average, CFNAI-MA3, increased to –0.18 in March from –0.31 in February. March’s CFNAI-MA3 suggests that growth in national economic activity, while still below average, continues to improve.
 Click on table for larger image in new window.
This graph shows the Chicago Fed National Activity Index (three month moving average) since 1967. According to the Chicago Fed:
A zero value for the index indicates that the national economy is expanding at its historical trend rate of growth; negative values indicate below-average growth; and positive values indicate above-average growth.We are now about 9 months into the recovery, and growth by most indicators is still below trend.
Weekly Initial Unemployment Claims at 448,000
by Calculated Risk on 4/29/2010 08:30:00 AM
The DOL reports on weekly unemployment insurance claims:
In the week ending April 24, the advance figure for seasonally adjusted initial claims was 448,000, a decrease of 11,000 from the previous week's revised figure of 459,000. The 4-week moving average was 462,500, an increase of 1,500 from the previous week's revised average of 461,000.
...
The advance number for seasonally adjusted insured unemployment during the week ending April 17 was 4,645,000, a decrease of 18,000 from the preceding week's revised level of 4,663,000.
 Click on graph for larger image in new window.
This graph shows the 4-week moving average of weekly claims since 1971.
The four-week average of weekly unemployment claims increased this week by 1,500 to 462,500.
The dashed line on the graph is the current 4-week average. The current level of 448,000 (and 4-week average of 462,500) is still high, and suggests continuing weakness in the labor market.
The 4-week average first declined to this level in December 2009, and has essentially moved sideways for four months.


