 RSS Feed
 by Calculated Risk on 4/27/2010 07:09:00 PM
Tuesday, April 27, 2010
ATA Trucking Index increases in March
It was a busy day with the Goldman Sachs testimony, Greece and Portugal downgrades, and the "mixed" Case-Shiller House Prices for February. Here is something more upbeat ...
From the American Trucking Association: ATA Truck Tonnage Index Rose 0.4 Percent in March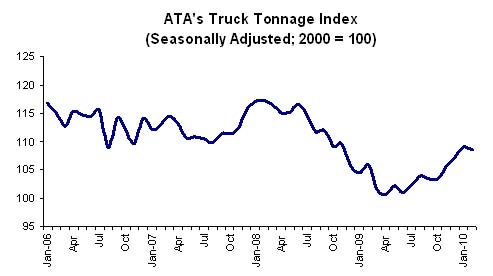
The American Trucking Associations’ advance seasonally adjusted (SA) For-Hire Truck Tonnage Index increased 0.4 percent in March, following a revised 0.3 percent decrease in February. The latest improvement put the SA index at 109.2 (2000=100), which is the highest level since November 2008. ...Trucking is a coincident indicator for the economy, and this suggests a solid March after the dip in February.
Compared with March 2009, SA tonnage jumped 7.5 percent, which was the fourth consecutive year-over-year gain and the largest increase since January 2005. ...
ATA Chief Economist Bob Costello said that he is getting more optimistic about the motor carrier industry’s recovery. “Freight is moving in the right direction and I continue to hear from motor carriers that both the demand and supply situations are steadily improving.” Costello attributed the first-quarter improvement in tonnage to the growing economy and to a slight inventory build after some sectors slashed inventories by too much in 2009. Costello added: “For most fleets, freight volumes feel better than reported tonnage because the supply situation, particularly in the truckload sector, is turning quickly.”
Market Update
by Calculated Risk on 4/27/2010 03:56:00 PM
Making the rounds, a little Goldman humor (ht Brian):
"You want the truth? You can't handle the truth. Son, we live in a country with an investment gap. And that gap needs to be filled by men with money. Who's gonna do it? You? You, Middle Class Consumer? Goldman Sachs has a greater responsibility than you can possibly fathom. You weep for Lehman and you curse derivatives. You have that luxury. You have the luxury of not knowing what we know: that Lehman's death, while tragic, probably saved the financial system. And that Goldman's existence, while grotesque and incomprehensible to you, saves pension funds. You don't want the truth. Because deep down, in places you don't talk about at parties, you want us to fill that investment gap. You need us to fill that gap. "We use words like credit default swaps, collateralized debt obligation, and securitization? We use these words as the backbone of a life spent investing in something. You use 'em as a punchline. We have neither the time nor the inclination to explain ourselves to a commoner who rises and sleeps under the blanket of the very credit we provide, and then questions the manner in which we provide it! We'd rather you just said thank you and paid your taxes on time. Otherwise, we suggest you get an account and start trading. Either way, we don't give a damn what you think you're entitled to!"credit: StatsGuy at Baseline Scenario.
The S&P was off 2.34% today - not much compared to the huge rally over the last year ...
 Click on graph for larger image in new window.
From Doug Short: Bear Turns to Bull?
This graph from Doug is titled: "Four Bad Bears".
Note that the Great Depression crash is based on the DOW; the three others are for the S&P 500.
Real House Prices and the Unemployment Rate
by Calculated Risk on 4/27/2010 01:24:00 PM
Earlier today S&P released the Case-Shiller house price indexes for February, see: Case-Shiller House Prices "mixed" in February
Below is a comparison of real house prices and the unemployment rate using the First American Corelogic LoanPerformance national house price index (starts in 1976) and Case-Shiller Composite 10 index (starts in 1987). Both indexes are adjusted by CPI less shelter. This is an update to a post from almost a year ago. 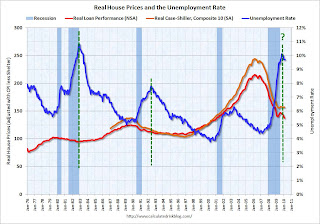 Click on image for larger graph in new window.
The two previous national declines in real house prices are evident on the graph (early '80s and early '90s). The dashed green lines are drawn at the peak of the unemployment rate following the peak in house prices.
The unemployment rate peak in 2009 is likely, but not certain.
In the early '80s, real house prices declined until the unemployment rate peaked, and then increased sluggishly for a few years. Following the late 1980s housing bubble, real house prices declined for several years after the unemployment rate peaked.
Although there are periods when there is no relationship between the unemployment rate and house prices - like during the bursting of the stock market bubble - this graph suggested to me that house prices would not bottom in real terms until the unemployment rate had peaked - and probably later (the recent housing bubble dwarfed the previous housing bubbles, and the bust will probably take some time).
Real prices, as measure by LoanPerformance, hit new lows in February, although real Case-Shiller prices are still fractionally above the lows of last year. I expect further declines in both indexes later this year, and this graph suggests that real house prices are probably still 10% or more too high on a national basis.
Real prices can decline because of falling nominal house prices (likely in my view) or from inflation (or a combination of both).
Note: earlier I mentioned that S&P has expressed concern about the Case-Shiller seasonal adjustment - here is the announcement from S&P.
S&P Downgrades Greece and Portugal
by Calculated Risk on 4/27/2010 11:42:00 AM
From MarketWatch: S&P cuts Greece ratings to junk status
Standard & Poor's said Tuesday it cut Greece's ratings to junk status. The ratings agency lowered the long-term sovereign credit rating on Greece to BB+ from BBB+. The outlook is negative.From CNBC:
S&P downgraded its rating on Portugal's debt by two notches to A-minus.
Video: Goldman's Blankfein Testifies to Congress
by Calculated Risk on 4/27/2010 09:55:00 AM
Goldman executives, including Chief Executive Lloyd Blankfein, will testify before the Senate Permanent Subcommittee on Investigations at 10 AM ET. There is apparently some interest in this testimony.
Here is the CNBC feed.
Here is the C-Span3 Link
Case-Shiller House Prices "mixed" in February
by Calculated Risk on 4/27/2010 09:00:00 AM
IMPORTANT: These graphs are Seasonally Adjusted (SA). S&P has cautioned that the seasonal adjustment is probably being distorted by irregular factors. These distortions could include distressed sales and the various government programs.
S&P/Case-Shiller released the monthly Home Price Indices for February (actually a 3 month average).
The monthly data includes prices for 20 individual cities, and two composite indices (10 cities and 20 cities).
From S&P: Home Prices Mixed in February 2010
Data through February 2010, released today by Standard & Poor’s for its S&P/Case-Shiller Home Price Indices, the leading measure of U.S. home prices, show that the annual rates of decline of the 10-City and 20-City Composites improved in February compared to January 2010. For the first time since December 2006, the annual rates of change for the two Composites are positive. The 10-City Composite is up 1.4% from where it was in February 2009, and the 20-City Composite is up 0.6% versus the same time last year. However, 11 of 20 cities saw year-over-year declines.
 Click on graph for larger image in new window.
 The first graph shows the nominal not seasonally adjusted Composite 10 and Composite 20 indices (the Composite 20 was started in January 2000).
The Composite 10 index is off 30.0% from the peak, and up slightly in February (SA).
The Composite 20 index is off 29.3% from the peak, and down slightly in February (SA).
 The second graph shows the Year over year change in both indices.
The Composite 10 is up 1.4% compared to February 2009.
The Composite 20 is up 0.6% compared to February 2009.
These are the first YoY price increases since 2006.
The third graph shows the price declines from the peak for each city included in S&P/Case-Shiller indices.
 Prices decreased (SA) in 15 of the 20 Case-Shiller cities in February.
 Prices in Las Vegas are off 55.7% from the peak, and prices in Dallas only off 6.0% from the peak.
Note: Congratulations to S&P: the new release format is excellent.
Morning Greece: Contagion Concerns
by Calculated Risk on 4/27/2010 08:24:00 AM
Greek government debt yields increased again this morning (ht Mike), from Bloomberg:
 |
From Bloomberg: Portugal Suffering Greek Contagion Pressures EU Bonds
With a higher debt burden and a slower 10-year growth rate than Greece, Western Europe’s poorest country is being punished by investors as the sovereign debt crisis spreads. ... Portugal’s credit default swaps show investors rank its debt as the world’s eighth-riskiest, worse than for Lebanon and Guatemala.From Bloomberg: Greece Bond Losses to Be ‘Significant,’ Buiter Says
Greece is likely to default or inflict “significant” losses on bondholders unless it receives more generous terms on its planned aid package, according to Willem Buiter, chief economist at Citigroup Inc.
Shanghai Composite index down 2.1%
by Calculated Risk on 4/27/2010 12:34:00 AM
Since I haven't posted a graph of the Shanghai index in some time ...
From MarketWatch: Shanghai Composite index down 2.1% at midday break
Mainland Chinese shares extend losses in the Tuesday morning session, with sharp retreats in commodity producers further pressuring markets already weighed by fears of policy tightening, especially in the property sector.
 Click on graph for larger image in new window.
This graph shows the Shanghai SSE Composite Index and the S&P 500 (in blue).
The SSE Composite Index is at 2,906.35 mid-day.
Monday, April 26, 2010
Home Tax Credit a Costly Failure
by Calculated Risk on 4/26/2010 09:40:00 PM
From David Kocieniewski at the NY Times: Home Tax Credit Called Successful, but Costly
Though the Treasury Department and the real estate industry have termed the program a success, helping 1.8 million people buy homes, many tax policy experts say it has been singularly cost-ineffective: most of the $12.6 billion in credits through end of February was collected by people who would have bought homes anyway or who in some cases were not even eligible.There is no question this program was very costly. And why is the Treasury confusing activity with accomplishment? Sure sales briefly surged, but were new households formed? How many new jobs were created?
“We were happy in our apartment, but $8,000 was just too much to pass up,” said [Mr. James Green, a student at Purdue University], 29, who shopped furiously with his wife for two months before signing a contract in March to buy a three-bedroom ranch.This is very optimistic - the ratio was probably 5-to-1 for the initial credit and even higher for the extension. But this shows two failures of the tax credit: 1) the high cost, and 2) it was just moving people from apartments to homes and didn't reduce the excess housing inventory (yes, rentals count as housing inventory too).
“We bid on a couple places that didn’t work out,” he said, “but we always made sure we had a backup plan because we didn’t want to miss the deadline for the credit. And when we finally agreed to a contract, it was this huge relief.”
For every home buyer like the Greens, real estate agents say there are at least three others who collected the credit even though they would have bought without it. That means for each new buyer who was truly lured into the market by the credit, the federal government paid more than $30,000.
“The tax credit helped to stanch the price declines, which had substantial benefit for the entire economy,” said Mark Zandi at Moody’s Economy.com.And this has been the policy - support asset prices by limiting the supply (all the foreclosure delays), and pushing demand (low mortgage rates and the tax credit). This has helped the banks significantly, and Zandi argues this has boosted confidence. Maybe ... but I'm not convinced that supporting house prices above the market clearing level to help the banks and boost consumer confidence makes sense. I think targeting jobs - and therefore household formation - would have been a far more cost effective program.
Yield on Greek Two-Year Bonds jumps to 13.5%
by Calculated Risk on 4/26/2010 05:49:00 PM
From the Financial Times: Greek bond markets plunge again
The yield on two-year Greek government bonds ... jumped 3 percentage points ... to close at 13.522 per cent.This is now higher than Venezuela at 11%.
This is the highest yield on short-dated government debt in the world ...
excerpt with permission
The yields jumped for some of the other PIIGS too (Portugal, Ireland, Italy, Greece and Spain). For Portugal the two-year yield increased more than 3/4 of a point to 3.98%.


