 RSS Feed
 by Calculated Risk on 4/21/2010 12:13:00 PM
Wednesday, April 21, 2010
Distressed Sales: Sacramento as an Example, March Update
The Sacramento Association of REALTORS® is breaking out monthly resales by equity sales (conventional resales), and distressed sales (Short sales and REO sales), and I'm following this series as an example to see mix changes in a distressed area.
Starting last month First American Corelogic has started releasing a distressed sales report - and that shows the trend in short sales and REOs nationally. Click on graph for larger image in new window.
Here is the March data.
The Sacramento Association started breaking out REO sales in 2008, but they have only broken out short sales since June 2009. Almost 65% of all resales (single family homes and condos) were distressed sales in March.
Note: This data is not seasonally adjusted, although the increase in sales in March is slightly above normal because of the tax credit. The second graph shows the percent of REO, short sales and conventional sales. The percent of short sales is near the high set in December. This will probably continue to increase this year (2010 is the year of the short sale!).
Also total sales in March were off 3.4% compared to March 2009; the tenth month in a row with declining YoY sales - even with a surge from tax credit buying this year!
On financing, nearly 60 percent were either all cash (27.1%) or FHA loans (31.5%), suggesting most of the activity in distressed former bubble areas like Sacramento is first time home buyers using government-insured FHA loans, and investors paying cash.
Architecture Billings Index shows contraction in March
by Calculated Risk on 4/21/2010 08:57:00 AM
Note: This index is a leading indicator for Commercial Real Estate (CRE) investment.
The WSJ reports that the American Institute of Architects’ Architecture Billings Index increased to 46.1 in March from 44.8 in February. Any reading below 50 indicates contraction.
"This is certainly an encouraging sign that we could be moving closer to a recovery phase, even though we continue to hear about mixed conditions across the country," said Kermit Baker, chief economist at the American Institute of ArchitectsThe ABI press release is not online yet.
 Click on graph for larger image in new window.
This graph shows the Architecture Billings Index since 1996. The index has remained below 50, indicating falling demand, since January 2008.
The second graph compares the Architecture Billings Index with the year-over-year change in non-residential structure investment.
 Historically, according to the AIA, there is an "approximate nine to twelve month lag time between architecture billings and construction spending" on non-residential construction. This suggests further significant declines in CRE investment through all of 2010, and probably longer.
Note: Nonresidential construction includes commercial and industrial facilities like hotels and office buildings, as well as schools, hospitals and other institutions.
And more on CRE: Fitch: U.S. CMBS Loan Defaults to Exceed 11% by End of 2010
Loan defaults will continue to escalate for U.S. CMBS, with an additional 4.4% likely in 2010 and the overall rate to exceed 11% among Fitch-rated deals by the end of the year, according to Fitch Ratings.
... For the first time in five years, multifamily was not the property type with the most new defaults, with that distinction going to retail (32.3%) last year. Following retail was multifamily (22.1%), office (20.2%) and hotel (17.8%). Fitch projects sizeable default increases for each property type, with rates likely to increase at accelerated rates for office and hotel loans.
'Office defaults spiked in the fourth quarter last year, with further rental and net operating income declines likely through next year before a rebound takes place,' said Senior Director Richard Carlson.
MBA: Mortgage Purchase Applications Increase "Modestly"
by Calculated Risk on 4/21/2010 08:07:00 AM
The MBA reports: Mortgage Applications Increase in Latest MBA Weekly Survey
The Market Composite Index, a measure of mortgage loan application volume, increased 13.6 percent on a seasonally adjusted basis from one week earlier. ...
“Treasury rates fell last week causing a decline in mortgage rates. As a result, refinance applications picked up over the week, as some borrowers took advantage of this recent rate volatility to lock in a low fixed-rate loan,” said Michael Fratantoni, MBA’s Vice President of Research and Economics. “Purchase applications continued to increase coming out of the Easter holiday, as we approach the end of the homebuyer tax credit, and are up modestly over last month.”
The Refinance Index increased 15.8 percent from the previous week and the seasonally adjusted Purchase Index increased 10.1 percent from one week earlier. ...
The refinance share of mortgage activity increased to 60.0 percent of total applications from 58.9 percent the previous week. ...
The average contract interest rate for 30-year fixed-rate mortgages decreased to 5.04 percent from 5.17 percent, with points increasing to 0.98 from 0.91 (including the origination fee) for 80 percent loan-to-value (LTV) ratio loans.
 Click on graph for larger image in new window.
This graph shows the MBA Purchase Index and four week moving average since 1990.
So far the increase in activity because of the expiration of the tax credit has been "modest". I expect any increase this year to be less than the increase last year ...
Tuesday, April 20, 2010
Shiller: "Mini-bubble" in Stock and Housing Markets
by Calculated Risk on 4/20/2010 10:18:00 PM
Jennifer Schonberger at Motley Fool interviews Professor Robert Shiller: Shiller: The Housing Recovery Could Be on Shaky Ground.
A couple of comments from Shiller, first on house prices:
Robert Shiller: Home prices have been going up for nearly a year now, according to our data, the S&P/Case-Shiller indices ... Normally we could extrapolate that kind of upward trend because historically home prices have shown a lot of momentum. But I think we're in a very unusual circumstance because of the massive bailouts, the homebuyer tax credits, the Fed's purchase of mortgage-backed securities -- and these things are coming to an end. So it's an unusual period. So I don't trust the trend that we have. I'm worried that it might get reversed.And on asset prices:
Shiller: We have had kind of a mini-bubble in the stock market and the housing market. It wasn't just because of rate cuts. It was also because of government stimulus and bailouts. So the question is: Are we at risk for even more price increases, and another bubble? I think we are at risk, but I'm not predicting it. I think it's more likely we don't do so well from here.
NY Times: Up to 300,000 public school jobs could be cut
by Calculated Risk on 4/20/2010 06:48:00 PM
From Tamar Lewin and Sam Dillon at the NY Times: School Districts Warn of Even Deeper Teacher Cuts (ht Ann)
School districts around the country ... are warning hundreds of thousands of teachers that their jobs may be eliminated in June.These cuts will make the employment situation worse. This is also a reminder that the Federal stimulus spending peaks in Q2, and then starts to decline in Q3.
... their usual sources of revenue — state money and local property taxes — have been hit hard by the recession. In addition, federal stimulus money earmarked for education has been mostly used up this year.
...
Districts in California have pink-slipped 22,000 teachers. Illinois authorities are predicting 17,000 public school job cuts. And New York has warned nearly 15,000 teachers that their jobs could disappear in June.
Secretary of Education Arne Duncan estimated that state budget cuts imperiled 100,000 to 300,000 public school jobs. In an interview on Monday, he said the nation was flirting with “education catastrophe.”
DataQuick: Foreclosures moving to mid-to-high end
by Calculated Risk on 4/20/2010 04:00:00 PM
As a followup to the previous post, here is some more data from DataQuick:
"We are seeing signs that the worst may be over in the hard-hit entry-level markets, while problems are slowly spreading to more expensive neighborhoods. We're also seeing some lenders become more accommodating to work-outs or short sales, while others appear to be getting stricter about delinquencies. It's very noisy out there," [John Walsh, DataQuick president] said.The foreclosure rates in the mid-to-high end areas will never be as high as in the low end areas, but the percentage of total foreclosures will probably continue to increase. I also expect the average time in the foreclosure process to start to decrease this year as the lenders start clearing out the backlog.
The state's most affordable sub-markets, which represent 25 percent of the state's housing stock, accounted for 47.5 percent of all default activity a year ago. In first-quarter 2010 that fell to 40.9 percent.
California's mid- to high-end housing markets were more likely to have seen a rise in mortgage defaults last quarter, though the concentration of default activity - measured by defaults per 1,000 homes - remained relatively low in those areas.
For example, zip codes statewide with median home sale prices of $500,000-plus saw mortgage defaults buck the overall trend and rise 1.5 percent last quarter compared with the prior quarter, while year-over-year the decline was 19 percent (versus a 40.2 percent marketwide annual decrease). Collectively, these zips saw 4.5 default notices filed for every 1,000 homes in the community, compared with the overall market's rate of 9.3 NODs for every 1,000 homes statewide.
In zip codes with medians below $500,000, mortgage default filings fell 5.8 percent from the prior quarter and declined nearly 43 percent from a year earlier. However, collectively these zips saw 10.5 NODs filed for every 1,000 homes - more than double the default rate for the zips with $500,000-plus medians.
On average, homes foreclosed on last quarter spent 7.5 months winding their way through the formal foreclosure process, beginning with an NOD. A year ago it was 6.8 months. The increase could reflect, among other things, lender backlogs and extra time needed to pursue possible loan modifications and short sales.
Foreclosure resales accounted for 42.6 percent of all California resale activity last quarter. It was up from a revised 40.6 percent the prior quarter, and down from 57.8 percent a year ago, the peak.
DataQuick: California Notice of Default Filings Decline in Q1
by Calculated Risk on 4/20/2010 02:06:00 PM

Click on graph for larger image in new window.
This graph shows the Notices of Default (NOD) by year through 2009, and for Q1 2010, in California from DataQuick.
Although the pace of filings has slowed, it is still very high by historical standards.
From Alejandro Lazo at the LA Times: California foreclosures drop 4.2% as lenders work with troubled borrowers
Across California, a total of 81,054 homes received a notice of default in the first quarter compared with 84,568 in the fourth quarter of 2009 and a record 135,431 in the first quarter of 2009.In terms of new NOD filings, the peak was probably in 2009. A few key points:
Philly Fed State Coincident Indicators
by Calculated Risk on 4/20/2010 11:05:00 AM
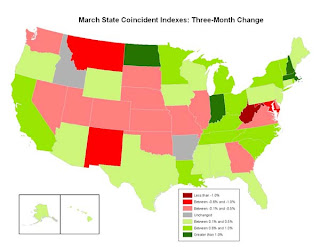 Click on map for larger image.
Here is a map of the three month change in the Philly Fed state coincident indicators. Seventeen states are showing declining three month activity. The index increased in 31 states, and was unchanged in 2.
Here is the Philadelphia Fed state coincident index release for March.
In the past month, the indexes increased in 35 states, decreased in 10, and remained unchanged in five (Georgia, Illinois, South Dakota, Utah, and Vermont) for a one-month diffusion index of 50. Over the past three months, the indexes increased in 31 states, decreased in 17, and remained unchanged in two (Arkansas and Idaho) for a three-month diffusion index of 28.
 The second graph is of the monthly Philly Fed data of the number of states with one month increasing activity. Based on this indicator, most of the U.S. was in recession in early 2008.
The last time the index was higher was in December 2007.
Note: this graph includes states with minor increases (the Philly Fed lists as unchanged).
DOT: Vehicle Miles Driven Decline in February
by Calculated Risk on 4/20/2010 08:52:00 AM
The Department of Transportation (DOT) reported today that vehicle miles driven in February were down from February 2009:
Travel on all roads and streets changed by -2.9%(-6.3 billion vehicle miles) for February 2010 as compared with February 2009. Travel for the month is estimated to be 212.9 billion vehicle miles.
Cumulative Travel for 2010 changed by -2.3% (-10.1 billion vehicle miles).
 Click on graph for larger image in new window.
This graph shows the percent change from the same month of the previous year as reported by the DOT.
As the DOT noted, miles driven in February 2010 were down -2.9% compared to February 2009.
 The second graph shows the moving 12 month total of miles driven (to remove seasonality).
The moving 12 month total peaked in November 2007. The impact on vehicle miles of the gasoline shortages in the '70s are clear - in the late '70s and early '80s, it took 40 months before vehicle miles returned to the peak of April 1979.
Blame it on the snow - except this is the 2nd month in a row with a year-over-year decline in miles driven. If vehicle miles continues to decline on a year-over-year basis, it might suggest high gasoline prices are starting to impact the economy.
Monday, April 19, 2010
Greece: Bond spreads widen as Bundesbank President says Greece may need more aid
by Calculated Risk on 4/19/2010 07:21:00 PM
An update on Greece: The IMF team was delayed arriving in Greece because of the ash from the Iceland volcano, meanwhile the Bundesbank president was quoted as saying Greece may need more aid.
Also the German Finance Minister was quoted in Der Spiegel: "We cannot allow the bankruptcy of a euro member state like Greece to turn into a second Lehman Brothers."
From the NY Times: Greek Debt Unsettles Bond Market
Yields on Greek bonds pushed to fresh highs on Monday ... as investors continued to worry about the country’s near-term ability to finance its debt. ... The yield on benchmark 10-year Greek government bonds closed in Europe at 7.63 percent — the highest since Greece joined the euro. That widened the spread, or difference, with equivalent German bonds to 4.55 percentage points.From Bloomberg: Weber Said to Tell German Lawmakers Greece May Need More Aid
Bundesbank President Axel Weber told German lawmakers that Greece may need more aid than the 30 billion euros ($40 billion) promised by the European Union as the government in Athens struggles to push through planned spending cuts, two people present at the briefing said.An interview with German Finance Minister Wolfgang Schäuble in Der Speigel: 'We Cannot Allow Greece to Turn into a Second Lehman Brothers'
Schäuble: [W]e have experienced a financial crisis from which we in Europe must draw a clear lesson: We cannot allow the bankruptcy of a euro member state like Greece to turn into a second Lehman Brothers.
SPIEGEL: You are exaggerating. In past years, it's happened again and again that a country couldn't pay its debts, and yet that hasn't led to a collapse of the global financial system. Why should this be different in Greece's case?
Schäuble: Because Greece is a member of the European monetary union. Greece's debts are all denominated in euros, but it isn't clear who holds how much of those debts. For that reason, the consequences of a national bankruptcy would be incalculable. Greece is just as systemically important as a major bank.


