 RSS Feed
 by Calculated Risk on 4/20/2010 11:05:00 AM
Tuesday, April 20, 2010
Philly Fed State Coincident Indicators
 Click on map for larger image.
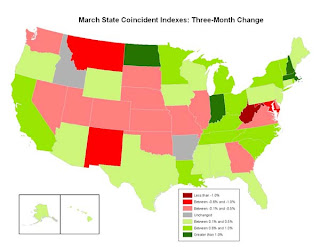
Here is a map of the three month change in the Philly Fed state coincident indicators. Seventeen states are showing declining three month activity. The index increased in 31 states, and was unchanged in 2.
Here is the Philadelphia Fed state coincident index release for March.
In the past month, the indexes increased in 35 states, decreased in 10, and remained unchanged in five (Georgia, Illinois, South Dakota, Utah, and Vermont) for a one-month diffusion index of 50. Over the past three months, the indexes increased in 31 states, decreased in 17, and remained unchanged in two (Arkansas and Idaho) for a three-month diffusion index of 28.
 The second graph is of the monthly Philly Fed data of the number of states with one month increasing activity. Based on this indicator, most of the U.S. was in recession in early 2008.
The last time the index was higher was in December 2007.
Note: this graph includes states with minor increases (the Philly Fed lists as unchanged).


