 RSS Feed
 by Calculated Risk on 4/14/2010 11:06:00 PM
Wednesday, April 14, 2010
Lawler: BoA and Chase on Second Mortgages
The following report is from housing economist Tom Lawler:
In a House Financial Services Committee meeting today on “Second Liens and Other Barriers to Principal Reduction as an Effective Foreclosure Mitigation Program, spokespersons from BoA, Citi, JPMorgan Chase, and Wells Fargo explained the potential dangers of broad principal reductions, as well as tried to dismiss the silly claim that many second mortgages have “virtually no value” because so many borrowers with seconds have total mortgage balances at or exceeding the value of the home collateralizing those mortgages. Below are some observations on BoA’s and Chase’s testimony.
BoA provided a few interesting stats: of the 10.4 million first lien mortgages that it services, 15% of second mortgages owned by BoA, while 16% have second mortgages with other lenders. (Thus, 31% have second liens!).
BoA also said that about 90% of BoA’s owned second-lien mortgage portfolio is made up of “standalone originations used to finance a specific customer need, such as education expenses or home improvements, with “(t)he remainder consists of piggy back (combo) loans originated with the home purchase.” BoA made this point to highlight that the vast bulk of its second mortgage lending was collateralized consumer credit lending, where the borrower’s ability to pay was a major factor behind extending the credit.
Here is what BoA said about their second mortgage portfolio:
“Most of our second loans continue to have collateral value, and of those where the second loan is underwater, a significant number are still performing. Indeed, out of 2.2 million second liens in Bank of America’s held for investment portfolio – only 91,000 seconds – about four percent – are (i) delinquent, (ii) behind a delinquent first mortgage and (iii) not supported by any equity.”
BoA’s spokesperson vexed a number of investors in first-lien mortgages (or securities backed by such mortgages) by saying that in cases where the first and second are held by different investors, the “logic of 2MP” (the administrations second mortgage program) where “the holder of the second lien is required to forebear a similar percentage as the first lien holder” seems “equitable” to BoA – despite the subordinate nature of the second, and despite the fact that the 2MP program does not require second mortgage holders to forgive principal, even when the first mortgage holder does!
Here is what Chase said about its Home Equity (second) mortgage portfolio:
Chase owns about $131 billion in Home Equity loans and lines as of February 28, 2010.
• Approximately $25 billion are home equity loans and $106 billion are home equity lines of credit.And on the issue of broad-based principal reduction programs, as well as the “subordinate” nature of second mortgages, here is what Chase had to say:
• Approximately $33 billion are in first lien position and $98 billion in second lien position.
• 5% of Chase’s home equity portfolio is 30 days or more delinquent. Total home equity line, home equity loan, first lien and second lien delinquency rates are within two percentage points of the overall total.
• About 50% of the total Chase second lien portfolio is underwater, and 95% of this portfolio is performing (less than 60 days past due). 30% of second lien mortgages have combined loan-to-value ratios over 125% and 94% of this portfolio is performing.
• For $40 billion of Chase-owned second lien mortgages, Chase also services a first lien mortgage:• 92% of these first lien mortgages are performing.• About 10% of Chase’s total serviced portfolio of first lien mortgage loans has a Chase-owned second lien.
• 28% of these first lien mortgages are by themselves underwater (loan- to-value ratio of over 100%).
• 45% of first lien mortgages have a combined loan- to-value ratio of over 100%.
• Our best estimate is that about 20% of Chase serviced first lien mortgages may have a second lien from another lender and about 70% do not have a second lien.
“We do think that large scale, broad–based principal reduction programs raise serious policy concerns, for both first and second lien mortgage loans, and particularly for current borrowers with an ability to repay their obligations. In Chase’s view, such programs could be potentially very harmful to consumers, investors and future mortgage market conditions – and should not be undertaken without first attempting other solutions, including more targeted modification efforts.
“Like all loans, mortgage contracts are based on a promise to repay money borrowed. Importantly, there is no provision in the mortgage contract, express or implied, that the lender will restore equity or reduce the repayment amount if the value of the collateral – be it a home, a car or a stock market investment – depreciates. If we re-write the mortgage contract retroactively to restore equity to any mortgage borrower because the value of his or her home declined, what responsible lender will take the equity risk of financing mortgages in the future? What responsible regulator would want lenders to take such risk?
“We are also concerned that broad-based principal reduction could result in reduced access to credit and higher costs for consumers if market risk to lenders and investors materially increases. Borrowers likely will be required to increase their down payments, credit criteria will be further tightened and risk premiums for mortgage credit will increase and get passed on to consumers. Less affluent borrowers would likely be harmed disproportionately.
“The benefits of a broad-based principal reduction program are to a large degree unknown and in Chase’s view, outweighed by the risks and the facts that we do know.”
And here is Chase on why many second loan portfolios are performing better than firsts, as well as the risks involved in broad-based principal reduction plans:
“Many borrowers remain current on their home equity loans because they want to honor their obligations and protect their credit. Our data show that 97% of borrowers in Chase’s $98 billion second lien portfolio are performing on their loans (less than 60 days past due). For second liens that have a cumulative loan-to-value ratio greater than 100%, 95% of borrowers are performing. Regardless of loan-to-value, as long as borrowers continue to do the right thing and fulfill their contractual obligations, second liens that are current and producing cash flow to investors have value."
“Additionally, a broad-based second-lien principal reduction plan would be forgiving past consumption by borrowers rather than housing investment. According to both internal Chase and Federal Reserve data, over 50% of borrowers used home equity loan proceeds for repayment of debt or personal consumption. No more than 15-20% used home equity proceeds to purchase a home. A broad-based program of principal reduction would be very expensive. To bring underwater borrowers “even” to a loan to value ratio of 100%, we estimate:
• It would have an industry-wide cost of $700 billion to $900 billion.And on the issue of LIEN priority, here is what Chase had to say:
• The cost to Fannie Mae, Freddie Mac and FHA alone would be in the neighborhood of $150 billion.
• The Federal Reserve and Department of Treasury would have additional exposure through their ownership interests and risk guarantees of AIG, GMAC, and other institutions.
• Mortgage lenders would incur a significant reduction in capital now, potentially impairing their ability to extend future credit – mortgage or otherwise.
• And if house prices decline further, the costs would be even higher, representing the implicit “put” at 100% CLTV. “
“It is important not to confuse payment priority with lien priority. In almost all scenarios, second lien holders have rights equal to a first lien holder with respect to a borrower’s cash flow. The same is true with respect to other secured or unsecured debt, such as credit cards or car loans. Generally, consumers can decide how they want to manage their monthly payments. In fact, almost 64% of borrowers who are 30-59 days delinquent on a first lien serviced by Chase are current on their second lien. It is only at liquidation or property disposition that first lien investors have priority.”
The banks’ testimony, of course, was in response to a letter from Barney Frank, who has been heavily lobbied (and influenced) by the Mortgage Investors Coalition to get second mortgage holders to write down their loans. In that letter Congressman Frank incorrectly argued that because many borrowers with second mortgages have total mortgage indebtedness that exceeds the value of their homes, these second mortgages “have no real economic value,” and he urged banks “in the strongest possible terms to take immediate steps to write down these second mortgages.”
Here, by the way, are some residential mortgage servicing statistics as of the end of last year for the top four mortgage servicers:
| 12/31/2009 | Delinquency Stats: Q4/09 | |||||
|---|---|---|---|---|---|---|
| Company Name | Number of Loans Serviced1 | 30-day | 60-day | 90+-day | In Foreclosure | Total Past Due |
| Bank of America | 14,011,029 | 3.4% | 1.7% | 6.5% | 3.3% | 14.8% |
| Wells Fargo | 12,168,836 | 2.4% | 1.2% | 3.5% | 1.9% | 9.0% |
| Chase | 9,689,312 | 3.0% | 1.4% | 4.6% | 3.2% | 12.2% |
| CitiMortgage, Inc. | 5,118,563 | 2.3% | 1.4% | 4.9% | 1.7% | 10.4% |
1 includes first liens and subordinate liens
These “mega” servicers were, through the economies of scale in processing payments, able to charge a pretty small fee to service loans and still make what appeared to be a decent amount of money. However, as problem loans mounted it became clear that the companies were woefully understaffed to deal with these problem loans effectively, leading to extremely poor loss mitigation efforts, poorly designed foreclosure prevention/modification programs.
All of these companies finally began materially increasing the size of their staffs devoted to troubled loan management, and the administration’s HAMP effort helped prompt them to do so by providing hefty premiums to servicers. However, it took companies quite a while to get staff and board and train them, as was clearly evidence in last year’s overall servicing performance.
NOTE: This was from housing economist Tom Lawler.
Iceland Bank "Black Report"
by Calculated Risk on 4/14/2010 08:16:00 PM
The English version of the Black Report on the Iceland bank failures was released today. It has it all - regulatory capture, oblivious politicians, shadow banking, loans to shareholders to buy shares and more. (ht Steinn)
Here is the website with the English version.
The following graph is from Chapter 21: Causes of the Collapse of the Icelandic Banks - Responsibility, Mistakes and Negligence Click on graph for larger image in new window
Here is an excerpt from the long report:
[This figure] shows the lending of the three big banks’ parent companies, classified by type of borrowers. The lending by the parent companies amounted usually to 50-60% of all lending by the banking groups from mid-2004. ... the largest and steadiest increase in lending was to holding companies on the one hand and to foreign parties on the other. The increase in lending to foreign parties was notably larger. The increase was especially big during the latter part of 2007. During the first part of 2007 the Icelandic banks increased their lending to foreign parties by 800 million EUR, to 8.3 billion EUR. During the latter part of that year, i.e. after the beginning of the international liquidity crisis in mid-summer 2007, the lending to foreign parties increased however by 11.4 billion EUR, to 20.7 billion EUR. Thereby, lending by the banks’ parent companies to foreign parties increased by more than 120% in just six months. As stated in Chapter 8, this increase was seen in all three banks, an increase of 5 billion in Kaupthing and 3 billion each in Landsbanki and Glitnir. The [Special Investigation Commission] (SIC) notes that this increased lending started at about the same time as the liquidity crisis in the international financial markets began. The increase was so substantial that it can be assumed that many of the new customers had turned to the Icelandic banks after other banks had made arrangements to reduce their lending and that these customers had therefore been refused service by other banks.It sounds like the Icelandic banks were making bad loans right at the wrong time.
One of the key problems identified in the report is "weak equity". Although some of these arrangment were complicated, basically the bank would loan money to an owner who would buy shares in the bank - and use those shares as collateral for the loan. This boosted the apparent capital, and allowed the bank to lend more money. Amazing.
The largest owners of all the big banks had abnormally easy access to credit at the banks they owned, apparently in their capacity as owners.Geesh - that reminds me of Enron.
...
The banks had invested their funds in their own shares. Share capital, financed by the company itself, is not the protection against loss it is intended to be. Here this is referred to as “weak equity”. Weak equity in the three banks amounted to about ISK 300 billion by mid year 2008. At the same time, the capital base of the banks was about ISK 1,186 billion in total. Weak equity, therefore, represented more than 25% of the banks’ capital base. If only the core component of the capital base is examined, i.e. shareholders’ equity, according to the annual accounts, less intangible assets, the weak equity of the three banks amounted to more than 50% of the core component in mid year 2008.
Here is the executive summary for a quick read.
HAMP March Data
by Calculated Risk on 4/14/2010 05:45:00 PM
From Treasury: Administration Releases March Loan Modification Report
 |
About 228,000 modifications are now "permanent", and 155,000 trial modification cancelled. There is still a huge number of borrowers in limbo. If we add the 228,000 permanent mods, plus 155,000 cancelled, and the 108,000 pending permanent mods that is only 491,000 borrowers - there were 825,000 borrowers in the program as of last November. So there are another 334,000 borrowers in modification limbo.
Here is the report. See here for a list of reports.
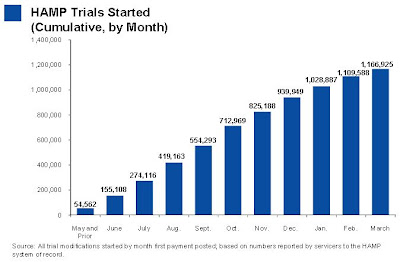 |
The second graph shows the cumulative HAMP trial programs started.
Notice that the pace of new trial modifications has slowed sharply from over 150,000 in September to around 57,000 in March 2010. This is slowest pace since May 2009 and is probably because of two factors: 1) servicers are now pre-qualifying borrowers, and 2) servicers are running out of eligible borrowers.
Debt-to-income ratios worsen
If we look at the HAMP program stats (see page 6), the median front end DTI (debt to income) before modification was 44.8% - down slightly from 45% last month. And the back end DTI was an astounding 77.5% (up from 76.4% last month).
Just imagine the characteristics of the borrowers who can't be converted!
No wonder the re-default rate is high ... from David Streitfeld at the NY Times: Defaults Rise in Loan Modification Program
The number of homeowners who secured cheaper mortgages through the government’s modification program only to default again nearly doubled in March, continuing a worrisome trend that threatens to undermine the entire program.In summary: 1) the program is slowing, 2) the borrowers DTI characteristics are poor - and getting worse, and 3) the re-default rate is rising. Oh, and 4) there are a large number of borrowers in modification limbo.
Treasury Department data released Wednesday showed that 2,879 loans that were permanently modified have defaulted since the program’s inception in the fall, up from 1,499 in February and 1,005 in January.
Rail Traffic increases in March
by Calculated Risk on 4/14/2010 03:28:00 PM
From the Association of American Railroads: Rail Time Indicators. The AAR reports traffic in March 2010 was up 7.5% compared to March 2009 - the first year-over-year increase since July 2008 - although traffic was still 11.5% lower than in March 2008.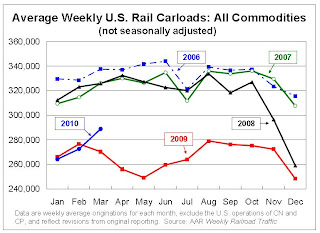 Click on graph for larger image in new window.
This graph shows U.S. average weekly rail carloads. Traffic increased in 16 of the 19 major commodity categories YoY.
From AAR:
• On a non-seasonally adjusted basis, U.S. freight railroads originated 1,443,967 carloads in March 2010, up 7.5% (100,624 carloads) from March2009 and the first year-over-year increase since July 2008(see chart)The graph above shows that rail traffic collapsed in November 2008, and now nine months into the recovery, traffic hasn't even recovered half way. This is clearly not a "V-shaped" recovery - this is far more moderate and sluggish (although the pickup in March traffic was sharp).
• On a seasonally adjusted basis, U.S. carloads in March 2010 were up 3.9% from February 2010.
• Note, though, that carloads in March 2010 were still 11.5% lower than they were in March 2008, and in all 19 commodity categories carloads were lower in March 2010 than they were in March 2008. Railroads need many more monthly increases to get back to where they were prior to the downturn.
excerpts with permission
 The second graph from the AAR report shows lumber rail traffic compared to U.S. housing starts.
From the AAR:
Seasonally-adjusted housing starts fell 5.9% in February 2010 to an annualized 575,000 from a revised 611,000 in January 2010. February 2010’s housing starts were almost the same as they were in February 2009. The bottom line is that the housing recession that’s now more than four years old shows no sign of ending.Residential investment is moving sideways with no recovery in sight.
Fed's Beige Book: Economic activity increased "somewhat"
by Calculated Risk on 4/14/2010 01:59:00 PM
From the Federal Reserve: Beige book
Overall economic activity increased somewhat since the last report across all Federal Reserve Districts except St. Louis, which reported "softened" economic conditions. Districts generally reported increases in retail sales and vehicle sales.On Real Estate:
Residential real estate activity increased, albeit from low levels, in most Districts, with the exceptions of St. Louis, where it was mixed, and San Francisco, where it was flat. Contacts in Philadelphia, Cleveland and Kansas City expressed concern about whether sales would continue to grow after the expiration of the first-time home buyer tax credit. New York, Kansas City, Dallas and San Francisco noted sluggish sales for high-end homes. Home prices were stable across most Districts, but decreased in parts of the New York and Atlanta Districts. Residential construction activity increased slightly in New York, Atlanta, St. Louis, Minneapolis and Dallas, but remained weak in Cleveland, Chicago and San Francisco.
Commercial real estate activity was slow across the nation. Notable exceptions were Richmond, which saw an uptick in commercial leasing, and Dallas, where the sector was mixed and might be nearing bottom. In Boston, leasing activity consists largely of renewals, with many renewing tenants leasing less space. Manhattan Class A office rents were down 20 percent to 25 percent year over year. Contacts in Philadelphia, Richmond, Kansas City and Dallas expressed concern that lease concessions from landlords were putting downward pressure on rents. Commercial construction continued to be weak in most Districts. Cleveland saw some development in the energy and industrial segments.
San Diego: A "Surge" in Foreclosures
by Calculated Risk on 4/14/2010 11:39:00 AM
From Eric Wolff at the North County Times: Major lender signals surge in local foreclosures
Bank of America ... ramped up its foreclosure activity in March, sending hundreds of letters warning delinquent borrowers in the region that it could sell their homes at auction in as little as three weeks ... The bank said the increased activity was a natural consequence of borrowers running out of options.This fits with what Irvine Renter reported last month on the Irvine Housing Blog.
Analysts and real estate agents said the moves ... could signal a final reckoning for homeowners who have been protected by government programs for months or even years.
...
The notices went to 230 homeowners in North San Diego County, a 69 percent increase from February, and to 391 owners in Southwest Riverside County, up 67 percent from February.
By comparison, in March 2009, ReconTrust sent a total of 31 such letters to both regions combined
...
"We have reported recently that we anticipate a rise in foreclosure activity through the coming months as homeowners are unable to qualify for loan modifications, fall out of modification programs or go into delinquency due to the ongoing stress in the economy," [Richard Simon, a Bank of America spokesman] said.
Retail Sales increase sharply in March
by Calculated Risk on 4/14/2010 08:44:00 AM
On a monthly basis, retail sales increased 1.6% from February to March (seasonally adjusted, after revisions), and sales were up 7.6% from March 2009 (easy comparison).  Click on graph for larger image in new window.
This graph shows retail sales since 1992. This is monthly retail sales, seasonally adjusted (total and ex-gasoline).
The red line shows retail sales ex-gasoline and shows the increase in final demand ex-gasoline has been sluggish.
Retail sales are up 8.3% from the bottom, but still off 4.4% from the peak. The second graph shows the year-over-year change in retail sales (ex-gasoline) since 1993.
Retail sales ex-gasoline increased by 5.3% on a YoY basis (7.6% for all retail sales). The year-over-year comparisons are easy now since retail sales collapsed in late 2008. Retail sales bottomed in December 2008.
Here is the Census Bureau report:
The U.S. Census Bureau announced today that advance estimates of U.S. retail and food services sales for March, adjusted for seasonal variation and holiday and trading-day differences, but not for price changes, were $363.2 billion, an increase of 1.6 percent (±0.5%) from the previous month and 7.6 percent (±0.5%) above March 2009. Total sales for the January through March 2010 period were up 5.5 percent (±0.3%) from the same period a year ago. The January to February 2010 percent change was revised from +0.3 percent (±0.5%)* to +0.5 percent (±0.3%).This is a strong retail sales report.
MBA: Mortgage Applications Decrease as FHA Insurance Rates Increase
by Calculated Risk on 4/14/2010 07:51:00 AM
The MBA reports: Mortgage Applications Decrease in Latest MBA Weekly Survey
The Market Composite Index, a measure of mortgage loan application volume, decreased 9.6 percent on a seasonally adjusted basis from one week earlier. ...
"Applications for government mortgages dropped substantially last week, following the implementation of an increase in FHA mortgage insurance premiums," said Mike Fratantoni, MBA's Vice President of Research and Economics. "Applications for conventional mortgages also dropped last week, with refinance application volume continuing to drop following last week's jump in rates.”
The Refinance Index decreased 9.0 percent from the previous week, marking the index’s fifth consecutive decline. The seasonally adjusted Purchase Index decreased 10.5 percent from one week earlier. ...
The refinance share of mortgage activity increased to 58.9 percent of total applications from 58.7 percent the previous week. ...
The average contract interest rate for 30-year fixed-rate mortgages decreased to 5.17 percent from 5.31 percent, with points increasing to 0.91 from 0.64 (including the origination fee) for 80 percent loan-to-value (LTV) ratio loans.
 Click on graph for larger image in new window.
This graph shows the MBA Purchase Index and four week moving average since 1990.
If there is any increase in activity because of the expiration of the tax credit, it will probably be this month. I expect any increase this year to be less than the increase last year ...
Tuesday, April 13, 2010
Household Debt as a Percent of GDP
by Calculated Risk on 4/13/2010 07:37:00 PM
From Neil Irwin at the WaPo: Economic data don't point to boom times just yet
"There have always been Wall Street economists wanting to cheerlead the recovery, and quick to jump on any piece of news showing a great boom is around the corner," said Kenneth Rogoff, a Harvard economist. "The data so far are more consistent with a very moderate recovery."
There are a number of reasons that would be the case. American households are trying to reduce debt to stabilize finances. But they are doing so slowly, with total household debt at 94 percent of gross domestic product in the fourth quarter down just slightly from 96 percent when the recession began in late 2007.
...
"When you have a recession that's amplified by a deep financial crisis, the recovery is slower and more painful, much akin to recovering from a heart attack," said Rogoff ... "It just takes time. If you look at a typical recovery, we would be growing at 7 or 8 percent by now given the depth of our fall."
 Click on graph for larger image.
This graph, based on the Federal Reserve Flow of Funds data, shows household debt as a percent of GDP through Q4 2009 (note: I removed a few non-profit categories).
Note that the household debt problem is mostly a mortgage debt problem. Mortgage debt as a percent of GDP started really picking up in 2001 and 2002 and continued to increase sharply through 2006.
There was also a sharp increase in mortgage debt in the late '80s. That was partially associated with Tax Reform Act of 1986 that only allowed mortgage debt to be tax deductible, and excluded interest on all personal loans including credit card debt. There was also a smaller housing bubble in the late '80s that was associated with the increase in mortgage debt.
 The second graph shows the annual change in the percent of household mortgage debt.
 There was some increase in the late '90s associated with the booming economy and stock bubble wealth effect. But the real boom in mortgage debt started in the 2nd half of 2001 - and continued through 2006. This rapid increase in mortgage debt should have been a red flag for regulators.
Finally, on Rogoff's comment about "Wall Street economists wanting to cheerlead the recovery", there is an old saying on Wall Street for analysts: Bearish equals unemployed. Of course they are cheerleading!
DataQuick: SoCal house sales increase in March, "propped up" with FHA-insured loans
by Calculated Risk on 4/13/2010 03:06:00 PM
From DataQuick: More Incremental Gains for Southland Real Estate Market
A total of 20,476 new and resale homes sold in Los Angeles, Riverside, San Diego, Ventura, San Bernardino and Orange counties last month. That was up 33.3 percent from 15,359 in February, and up 5.0 percent from 19,506 in March 2009, according to MDA DataQuick of San Diego.The SoCal market is mostly first time homebuyers using FHA-insured loans, and investors paying cash. Note that foreclosure resales don't include short sales - so the 38.4% foreclosures is not all of the distressed sales (probably over 50% in SoCal).
...
“It’s a reflection of just how grim things got, that we’ve now had almost two years of sales gains and we’re still 18 percent below the sales average. ...” said John Walsh, MDA DataQuick president.
...
Foreclosure resales accounted for 38.4 percent of the resale market last month, down from 42.3 percent in February, and down from 54.8 percent a year ago. The all-time high was in February 2009 at 56.7 percent.
...
Meanwhile, Uncle Sam continues to prop up lending for many low-to mid-priced homes. Government-insured FHA loans, a popular choice among first-time buyers, accounted for 38.6 percent of all mortgages used to purchase Southland homes in March.
Absentee buyers – mostly investors and some second-home purchasers – bought 21.3 percent of the homes sold in March.
Buyers who appeared to have paid all cash – meaning there was no indication that a corresponding purchase loan was recorded – accounted for 27.1 percent of March sales. In February it was a revised 30.0 percent – an all-time high. The 22-year monthly average for Southland homes purchased with cash is 13.8 percent.


