 RSS Feed
 by Calculated Risk on 4/13/2010 01:06:00 PM
Tuesday, April 13, 2010
Kirsten Grind Blogging the WaMu Hearing
Kirsten Grind at the Puget Sound Business Journal is blogging from the WaMu hearing. How about this quote?
"My opinion is the OTS examiner in charge during the period of time I was there did an excellent job of finding and raising issues. Likewise, I found good performance from the FDIC examiner in charge. What I can't explain is why the superior in the agencies didn't take a tougher tone with banks, given the degree of negative findings. My experience with the OTS and OCC (Office of Comptroller of the Currency, another federal bank regulator) was completely different, so there seemed to be a tolerance there or political influence of senior management of those agencies that prevented them from taking more active stances — I mean, putting banks under letters of agreement and forcing change."We have seen this over and over. Every time the inspector general's office issues a report on a failed bank, the field examiners had correctly identified the problems - usually going back to 2003 or so - but no further action was taken.
James Vanasek, who was the former chief risk and credit officer of WaMu from 1999 to 2005
Vanasek is arguing this was possibly because of "political influence of senior management of those agencies" - the political appointees in charge. I've heard the same thing from examiners.
Ceridian-UCLA: Diesel fuel consumption increases in March
by Calculated Risk on 4/13/2010 11:43:00 AM
This is the new UCLA Anderson Forecast and Ceridian Corporation index using real-time diesel fuel consumption data: Pulse of Commerce IndexTM
Press Release: March PCI Increase Indicates U.S. Economy on 4 Percent Growth Track
Ceridian-UCLA Pulse of Commerce Index™ (PCI) by UCLA Anderson School of Management staged a healthy comeback in March, with the PCI growing by 1 percent, making up for February’s snowstorm-induced decline of 0.7 percent. The adjusted index grew from 107.4 to 108.5, continuing its climb from a recessionary low of 100.7 in June 2009. ... [T]he March PCI shows growth over the prior year period for the fourth consecutive month. This follows twenty-two consecutive months of year-over-year declines experienced prior to December 2009.
...
“The good news in March is that the economy is still recovering at a pace that should support job growth, although unfortunately not at a pace that will drive rapid improvement in the unemployment rate. GDP needs to grow at a 5 to 6 percent rate to drive meaningful change in unemployment,” said Ed Leamer, chief economist for the PCI.
For the first quarter of 2010, the PCI grew at an annualized rate of 9.7 percent, a solid gain but not enough to offset the declines of 14 percent and 16 percent suffered in the fourth quarter of 2008 and the first quarter of 2009. “In other words, we fell into the recession much more rapidly than we are climbing out of it,” Leamer said.
 Click on graph for larger image in new window.
This graph shows the index since January 1999 (monthly and 3 month average). There is significant variability month to month.
Note: This index appears to lead Industrial Production (IP), but there is a significant amount of monthly noise.
This is a new index and might be interesting to follow along with the Trucking and Railroad data.
Trade Deficit increases in February
by Calculated Risk on 4/13/2010 08:54:00 AM
The Census Bureau reports:
[T]otal February exports of $143.2 billion and imports of $182.9 billion resulted in a goods and services deficit of $39.7 billion, up from $37.0 billion in January, revised.
 Click on graph for larger image.
The first graph shows the monthly U.S. exports and imports in dollars through February 2010.
On a year-over-year basis, exports are up 14% and imports are up 20%. This is an easy comparison because of the collapse in trade at the end of 2008 and into early 2009. This is the first time since late 2008 that imports are up a greater percentage than imports on a YoY basis as export growth appears to have slowed.
The second graph shows the U.S. trade deficit, with and without petroleum, through February.
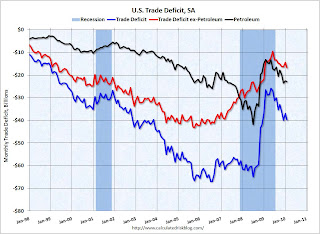 The blue line is the total deficit, and the black line is the petroleum deficit, and the red line is the trade deficit ex-petroleum products.
Import oil prices decreased slightly to $72.92 in February - but are up 86% from the low of one year ago in February 2009 (at $39.22). Oil import volumes declined in February.
In general trade has been increasing, although both imports and exports are still below the pre-financial crisis levels. Exports boosted the economy over the last year, however it now appears that export growth has slowed. Imports are still increasing even with the lower oil deficit in February.
Small Business Index Declines in March
by Calculated Risk on 4/13/2010 08:18:00 AM
From the National Federation of Independent Business: Small Business Optimism Declines in March
The National Federation of Independent Business Index of Small Business Optimism lost 1.2 points in March, falling to 86.8. The persistence of index readings below 90 is unprecedented in survey history.
“The March reading is very low and headed in the wrong direction,” said Bill Dunkelberg, NFIB chief economist. “Something isn’t sitting well with small business owners. Poor sales and uncertainty continue to overwhelm any other good news about the economy.”
...
After a devastating period of employment reductions, employment change per firm hit the “zero line” in March. .... While actual job reductions may have halted, plans to create new jobs remain weak. ... Only nine percent (seasonally adjusted) reported unfilled job openings, down two points and historically low, showing little hope for a lower unemployment rate.
Monday, April 12, 2010
Report: Commuting Costs offset Lower House Prices
by Calculated Risk on 4/12/2010 11:15:00 PM
Something a little different ...
From the Boston Globe: Travel swells cost of housing
People who move to an outlying Boston suburb to find affordable housing or to get more house for their money often sacrifice the savings to higher transportation costs, according to a study to be released today by a national planning and land-use organization.Here is the report on Boston:
The report, by the Urban Land Institute, is the first to quantify by community not only commuting costs, but the price of daily transportation around often-sprawling suburbs.
This report analyzes the combined costs of housing and transportation for neighborhoods, cities, and towns throughout a Boston regional study area that extends south to Providence, Rhode Island; west to Worcester, Massachusetts; and northeast to Dover, New Hampshire.When gasoline prices rose to over $4 per gallon in 2008, it really crushed some exurban areas that were already hard hit by the housing bust. The old saying "Drive to you qualify" doesn't really make sense if the transportation costs offset the lower house prices.
Our analysis finds that the typical household in the study area spends upwards of $22,000 annually on housing, which represents roughly 35 percent of the median household income ($68,036). With transportation costs for the typical household reaching nearly $12,000 annually, the combined costs of housing and transportation account for roughly 54 percent of the typical household’s income.
Similar studies conducted for the San Francisco Bay Area and the Washington, D.C., region have found average housing and transportation cost burdens of 59 percent and 47 percent, respectively.
WaMu Hearings Start Tomorrow
by Calculated Risk on 4/12/2010 05:50:00 PM
Jim Puzzanghera at the LA Times has a preview: Washington Mutual created 'mortgage time bomb,' Senate panel finds
Before Washington Mutual collapsed ... its executives knowingly created "a mortgage time bomb" by steering borrowers to subprime mortgages and turning the loans into securities the company knew were likely to go bad, one of the most extensive investigations into the causes of the financial crisis has found.More from the WSJ: Senate Probe Finds Washington Mutual Ignored Warnings
...
"At times, WaMu selected and securitized loans that it had identified as likely to go delinquent" or securitized loans in which the company had discovered fraudulent activity, such as misstated income, without disclosing the information to investors, the committee found. The company's pay practices exacerbated the problem by rewarding loan officers and processors based on how many mortgages they could churn out.
The documents to be disclosed on Tuesday also reflect that employees routinely fabricated lending documents. "One Sales Associate admitted that during that crunch time some of the Associates would 'manufacture' asset statements …and submit them to the" loan processing center, according to one document. "She said the pressure was tremendous ... since the loan had already [been] funded."The Inspectors General's report on WaMu will be issued on Friday - Sewell Chan at the NY Times reported Saturday: U.S. Faults Regulators Over a Bank
Regulators failed for years to properly supervise the giant savings and loan Washington Mutual, even as the company wobbled ... a federal investigation has concluded.A huge bank out of control and regulators ignoring the problem ... this is quite a story. And no surprise at all.
...
The report, prepared by the inspectors general for the Treasury Department and the Federal Deposit Insurance Corporation, is expected to be released Friday. A draft was obtained by The New York Times.
PIMCO's Simon on a Post-Fed MBS Market
by Calculated Risk on 4/12/2010 02:34:00 PM
Scott Simon, Managing Director at PIMCO Discusses a Post-Fed Mortgage-Backed Securities Market. A few excerpts:
We are unlikely to see a significant market disruption in the Agency market stemming from the Fed’s retreat. ... if and when we see mortgages cheapen, we expect to see private institutions stepping in to buy. Even a 15 basis point move could spark a flurry of buying. Therefore, we don’t expect a major widening of mortgage spreads ...And some Q&A:
Q: Could you elaborate more on who will fill the purchasing gap left by the Fed’s exit?And finally on housing:
Simon: Money managers and other institutions have been sitting on the sidelines for quite a while, but cash yields are essentially zero, making it very tempting to move out the risk and duration spectrum. This is exactly what the Fed has meant to do with a fed funds rate near zero – make it so that investors can’t stand to be in cash any more. For banks, it makes the spread between cash and Agency mortgages look more attractive, and for investors, it makes risk-adjusted yields on Agencies look competitive.
...
Q: Do you think it’s at all likely the Federal Reserve will reboot its MBS purchase program later this year or in 2011?
Simon: Probably not. Barring a major double dip in the economy or housing, private balance sheets have plenty of room to add Agency MBS (unlike in late 2008, when the Fed program began).
Q: Finally, let’s discuss housing more directly. When might we see a recovery?My comments: In the low price / high foreclosure bubble areas, I think house prices bottomed over a year ago because of the flood of foreclosure sales (Tom Lawler's "destickification"), however I think there will be further price declines in the mid-to-high end bubbles areas. This is where many of the next wave of distressed sales will be concentrated. My guess is this will push the national price indexes (Case-Shiller, LoanPerformance) to new lows later this year and probably into 2011. And then any recovery in prices will be very slow because distressed sales will remain elevated for some time.
Simon: We continue to believe that lower-priced homes bottomed last year. Higher-priced homes should bottom later this year. If one labels recovery as prices rising dramatically, we do not foresee that anytime soon.
Q: Do you think the government is done tinkering with housing sales and foreclosures?
Simon: The three issues that need addressing are: 1) negative equity, 2) unemployment and 3) second liens hindering loan modifications. Obama’s plan addresses these issues, but the devil is in the details. ...
And 2nd liens remain a huge stumbling block. Dakin Campbell and David Henry at Bloomberg had a story on 2nd liens and banks this morning: Bank Profits Dimmed by Prospect of Home-Equity Losses (ht Brian, Mike in Long Island, Clip)
Bank of America Corp., JPMorgan Chase & Co. and Wells Fargo & Co. may have to set aside an additional $30 billion to cover possible losses on home-equity loans, an amount almost equal to analysts’ estimates of profit at the three banks this year.Although the article is focused on write-downs for the banks, this also has implications for the housing market.
The cost of these reserves was calculated by CreditSights Inc., a New York-based research firm whose prediction almost four years ago proved prescient after banks reported unprecedented mortgage-related writedowns. Recognizing the home- equity loan losses is unfinished business from the housing bubble ...
The four biggest U.S. banks by assets -- Bank of America, JPMorgan, Citigroup Inc. and Wells Fargo -- hold about 42 percent, or $442 billion of the $1.1 trillion in second-lien mortgage loans, according to Amherst Securities Group LP, an Austin, Texas-based firm that analyzes home-loan assets.
Recession Measures
by Calculated Risk on 4/12/2010 11:59:00 AM
Calling the beginning or end of a recession takes time. The National Bureau of Economic Research (NBER) waits until the data is revised, and if the recovery is sluggish, this process can take from 18 months to two years or longer.
In addition, if the economy slides into recession again, the committee will only consider it a new recession if most major indicators were close to or above their previous highs. Otherwise it will just be considered a continuation of the previous recession.
A good example of the NBER calling two separate recessions was in the early '80s, from the NBER memo:
"The period following July 1980 will appear in the NBER chronology as an expansion. An important factor influencing that decision is that most major indicators, including real GNP, are already close to or above their previous highs."It will take some time for most major indicators to be above their previous high after the "great recession" because of the severe contraction as the graphs below show.
emphasis added
GDP is the key measure, as the NBER committee notes in their business cycle dating procedure:
The committee views real GDP as the single best measure of aggregate economic activity.This is actually two measures: 1) real GDP, and 2) real Gross Domestic Income (GDI). For a discussion on GDI, see from Fed economist Jeremy Nalewaik, “Income and Product Side Estimates of US Output Growth,” Brookings Papers on Economic Activity. An excerpt:
The U.S. produces two conceptually identical official measures of its economic output, currently called Gross Domestic Product (GDP) and Gross Domestic Income (GDI). These two measures have shown markedly different business cycle fluctuations over the past twenty five years, with GDI showing a more-pronounced cycle than GDP. These differences have become particularly glaring over the latest cyclical downturn, which appears considerably worse along several dimensions when looking at GDI. ...The NBER uses both real GDP and real GDI.
In discussing the information content of these two sets of estimates, the confusion often starts with the nomenclature. GDP can mean either the true output variable of interest, or an estimate of that output variable based on the expenditure approach. Since these are two very different things, using “GDP” for both is confusing. Furthermore, since GDI has a different name than GDP, it may not be initially clear that GDI measures the same concept as GDP, using the equally valid income approach.
Note: The following graphs are all constructed as a percent of the peak in each indicator. This shows when the indicator has bottomed - and when the indicator has returned to the level of the previous peak. If the indicator is at a new peak, the value is 100%. On all graphs the recent recession is marked as ending in July 2009 or Q3 2009 - this is preliminary and NOT an NBER determination. GDP is quarterly, the other data is monthly.
The first graph is for GDP and GDI:
 Click on graph for larger image in new window.
It appears that GDP bottomed in Q2 2009 and GDI in Q3 2009. This is the key measure, and the NBER will probably use GDP and GDI to determine the trough of the recession. Real GDP is only 2.0% below the pre-recession peak - and real GDP 2.7% below the previous peak - so both could be at new highs later this year or early in 2011, even with a sluggish recovery.
 The second graph is for monthly industrial production based on data from the Federal Reserve.
Industrial production bottomed in June 2009. The NBER will consider this measure when trying to identify the month the recession ended. Note that industrial production is still substantially below the pre-recession levels - so it might be some time before this measure is at or above earlier levels.
Now for some less optimistic measures the NBER uses ...
 The third graph is for employment. It appears the employment recession might have bottomed in February, but it will take a long time before this measure is at pre-recession levels.
 Historically employment was a coincident indicator for the end of recessions, but that hasn't been true for the previous two recessions (1990-1991 and 2001) and also will not be true for the "great recession" if the NBER determines an end date in July 2009.
If the NBER waits for employment to return to pre-recession levels, we might be waiting for an annoucement for a long time.
 And the last graph is for real personal income excluding transfer payments. This bottomed in Sept 2009, but has moved sideways since then. This shows the effect of the stimulus programs that boosted GDP and income - but not income less transfer payments.
This will be a key measure of a sustainable recovery, and once again it will take a long time to return to pre-recession levels.
These graphs are useful in trying to identify peaks and troughs in economic activity. My guess is the economy bottomed by most measure in Q3 2009 (probably July), but I don't expect an announcement from the NBER until the end of 2010 at the earliest - and perhaps well into 2011 or beyond.
NBER: "Premature" to Call end of Recession
by Calculated Risk on 4/12/2010 08:59:00 AM
Business Cycle Dating Committee statement:
The Business Cycle Dating Committee of the National Bureau of Economic Research met at the organization’s headquarters in Cambridge, Massachusetts, on April 8, 2010. The committee reviewed the most recent data for all indicators relevant to the determination of a possible date of the trough in economic activity marking the end of the recession that began in December 2007. The trough date would identify the end of contraction and the beginning of expansion. Although most indicators have turned up, the committee decided that the determination of the trough date on the basis of current data would be premature. Many indicators are quite preliminary at this time and will be revised in coming months. The committee acts only on the basis of actual indicators and does not rely on forecasts in making its determination of the dates of peaks and troughs in economic activity. The committee did review data relating to the date of the peak, previously determined to have occurred in December 2007, marking the onset of the recent recession. The committee reaffirmed that peak date.NBER always waits some time before declaring a recession over.
 | Click on cartoon for larger image in new window. Repeat of cartoon from Eric G. Lewis |
The previous NBER announcements make it clear that NBER will not date the trough of the recession until certain economic indicators - like real GDP - are above the pre-recession levels. Any downturn before economic activity reaches pre-recession levels will probably be considered a continuation of the recession that started in December 2007.
Here is the NBER dating procedure.
Sunday, April 11, 2010
Report: Regulators failed to properly supervise WaMu
by Calculated Risk on 4/11/2010 11:49:00 PM
From Sewell Chan at the NY Times: U.S. Faults Regulators Over a Bank
Regulators failed for years to properly supervise the giant savings and loan Washington Mutual, even as the company wobbled ... a federal investigation has concluded.The FDIC rating system is called CAMELS and stands for Capital adequacy, Asset quality, Management, Earnings, Liquidity and Sensitivity to market risk. The scale is from 1 to 5, with 1 being the strongest. Banks with ratings of 4 or 5 are included on the FDIC's official problem bank list (ratings are not made public). So WaMu wasn't considered a "problem bank" until days before it collapsed.
...
The report, prepared by the inspectors general for the Treasury Department and the Federal Deposit Insurance Corporation, is expected to be released Friday. A draft was obtained by The New York Times.
... WaMu was the largest institution regulated by the Office of Thrift Supervision ... Although regulators found problems ... the office consistently deemed WaMu “fundamentally sound,” giving it a rating of 2, the second-highest on a five-point scale ... The office did not lower the rating to 3 ... until February 2008, and to 4 ... until September 2008, days before WaMu collapsed. “It is difficult to understand how O.T.S. continued to assign WaMu a composite 2 rating year after year,” the report found.
The report will apparently be released on Friday. Earlier reports for other bank failures showed that the field examiners identified the problems early - and then for some unexplained reason, no action was taken. The regulatory system failed.


