 RSS Feed
 by Calculated Risk on 12/12/2008 03:38:00 PM
Friday, December 12, 2008
Forecaster: Negative Q4 GDP in China
ISI's Ed Hyman is telling clients that he expects GDP growth in China at a 2% annual rate in Q3, and negative 1% in Q4 2008. This is far below most forecasts!
Hyman also lowered his Q4 U.S. GDP forecast to a 6% decline. Last month Goldman slashed their Q4 GDP forecast to minus 5%.
Q4 is definitely going to be an ugly quarter!
His forecast is not all negative: Although Hyman is forecasting a 4% U.S. GDP decline in Q1 2009, he thinks the economy will probably bottom mid-year 2009 (based on a substantial stimulus package from Obama), followed by a very sluggish recovery in the 2nd half of 2009, and slightly below trend growth in 2010. He thinks the stock market might have already bottomed.
Ecuador Defaults on Bonds
by Calculated Risk on 12/12/2008 02:41:00 PM
From Bloomberg: Ecuador Defaults on Bonds, Seeks Restructuring
Ecuador won’t make a $30.6 million bond interest payment due Dec. 15, putting the country in default for a second time this decade, President Rafael Correa said. ... His decision comes as a deepening global economic slump throttles demand for oil, the country’s biggest export. Ecuador, which defaulted in 1999, owes about $10 billion to bondholders, multilateral lenders and other countries.Ecuador exported about 400 thousand barrels of oil per day (2004 data) so the recent $100 per barrel drop in oil prices would be about $40 million per day less revenue. Other oil exporters will have problems too, although many oil exporters have significant foreign reserves.
DOT: Gasoline Demand Increases in October
by Calculated Risk on 12/12/2008 01:24:00 PM
The Dept of Transportation reports on U.S. Traffic Volume Trends:
Travel on all roads and streets changed by -3.5% (-9.0 billion vehicle miles) for October 2008 as compared with October 2007. Travel for the month is estimated to be 249.7 billion vehicle miles.
 Click on graph for larger image in new window.
This graph shows the annual change in the rolling 12 month average of U.S. vehicles miles driven through October (from DOT). The number of U.S. vehicle miles driven has fallen off a cliff with high gasoline prices, rising unemployment and an overall weaker economy. Note: the rolling 12 month average is used to remove noise and seasonality.
By this measure, vehicle miles driven are off 3.4% YoY, and the decline in miles driven is worse than during the early '70s oil crisis - and about the same as the 1979-1980 declines. Miles driven in October 2008 were 3.5% less than October 2007, however miles driven were up sharply from September. (Note: the usual pattern is for miles driven to increase from September to October by about 2.5%, however this October miles were up over 7% due to lower gasoline prices)
 The second graph shows the weekly U.S. gasoline prices from the EIA through Dec 1st. This shows that gasoline prices really started to decline in October (still high in September). So we have been waiting for the October and November vehicle mile reports to see the impact of sharply lower gasoline prices.
 As I noted in my thoughts on oil, I expected vehicle miles to start increasing again with lower prices. I believe the impact of price declines on driving behavior will more than offset higher unemployment and the weaker economy. This report suggests that view is correct.
Construction Employment as Percent of Total Employment
by Calculated Risk on 12/12/2008 01:00:00 PM
In the previous post, I excerpted from my post in 2005 arguing that the areas with the most real estate related employment would suffer the most in the then coming housing bust. That post included a graph through most of 2005. Here is an update to that graph using the current data from the BLS (through October for counties, and November for the U.S).
Note that all data is Not Seasonally Adjusted (NSA), hence the seasonal pattern. Click on graph for larger image in new window.
This graph shows construction as a percent of total employment (NSA) for the U.S., California, San Diego and California's Inland Empire.
As much as the U.S. saw an increase in construction employment (as a percent of total employment), California was a little more dependent on construction, San Diego even more - and the Inland Empire heavily dependent on construction employment.
This is construction only. Other construction related jobs probably follow the same pattern: real estate agents, mortgage brokers, inspectors, etc.
Here is the graph from the 2005 post: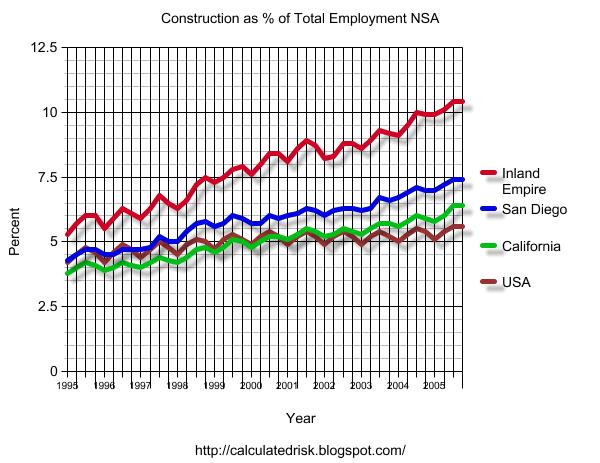 A little different graphics software (it was much hard to use).
Back in 2005, I argued
"California has become more dependent on construction than the rest of the country, and construction has really boomed in San Diego. But San Diego has nothing on the Inland Empire.
I believe that areas like the Inland Empire will suffer the most when housing activity slows."
Inland Empire Commercial Vacancy Rates Rise Sharply
by Calculated Risk on 12/12/2008 11:18:00 AM
California's Inland Empire is an interesting area to follow. During the housing boom, the local economy was heavily dependent on real estate related employment (see graph at bottom of post), and now, with the housing bust, the area is being devastated.
From the Press-Enterprise: Inland office, industrial space vacancies rise
Inland office vacancy rates reached 20 percent during the third quarter, according to the 2008 Southern California Office and Industrial Market Report, which was released Thursday by the Casden Forecast at the University of Southern California Lusk Center for Real Estate.No one could have predicted this .... oh wait, from one of my posts in 2005 (the graphics are better today!):
Almost 1.5 million square feet of office space was completed during the first nine months of this year, but demand for that property is so weak, mostly because of fallout from the region's housing slowdown, that most of that space remains vacant and is likely to be leased out slowly during the next 12 months, the report found.
...
The Inland industrial market also struggled during the first nine months of 2008, mostly because of the drop in imports at the ports of Los Angeles and Long Beach.
Industrial vacancy rates climbed from 4.9 percent during the third quarter of 2007 to 8.6 percent during this year's third quarter ...
Of all the areas experiencing a housing boom, the areas most at risk have had the greatest increase in real estate related jobs. These jobs include home construction, real estate agents, mortgage brokers, inspectors and more. The following graph uses NSA construction jobs for comparison purposes.I'll post an update to the employment graph.Click on graph for larger image.
Not surprisingly, California has become more dependent on construction than the rest of the country, and construction has really boomed in San Diego. But San Diego has nothing on the Inland Empire.
I believe that areas like the Inland Empire will suffer the most when housing activity slows.
Cartoon: Made Outta Ponies
by Calculated Risk on 12/12/2008 10:20:00 AM
 | Click on cartoon for larger image in new window. Cartoon from Eric G. Lewis |
White House Considers Using TARP for Automakers
by Calculated Risk on 12/12/2008 09:23:00 AM
From MarketWatch: White House considers using TARP for auto bailout
The Bush administration will consider ... using ... the Troubled Asset Relief Program, White House spokeswoman Dana Perino said Friday. "A precipitous collapse of this industry would have a severe impact on our economy, and it would be irresponsible to further weaken and destabilize our economy at this time," she said.
Retail Sales Off Sharply in November
by Calculated Risk on 12/12/2008 08:32:00 AM
The Census Bureau reports that retail sales collapsed in November:
The U.S. Census Bureau announced today that advance estimates of U.S. retail and food services sales for November, adjusted for seasonal variation and holiday and trading-day differences, but not for price changes, were $355.7 billion, a decrease of 1.8 percent from the previous month and 7.4 percent below November 2007. Total sales for the September through November 2008 period were down 4.5 percent from the same period a year ago. The September to October 2008 percent change was revised from -2.8 percent to -2.9 percent.The following graph shows the year-over-year change in nominal and real retail sales since 1993.
Retail trade sales were down 2.0 percent from October 2008 and were 8.5 percent below last year. Motor vehicle and parts dealers sales were down 25.2 percent from November 2007 and gasoline stations sales were down 22.0 percent from last year.
 Click on graph for larger image in new window.
To calculate the real change, the monthly PCE price index from the BEA was used (November PCE prices was estimated as the same as October).
Although the Census Bureau reported that nominal retail sales decreased 8.4% year-over-year (retail and food services decreased 7.4%), real retail sales declined by 10.1% (on a YoY basis). This is the largest YoY decline since the Census Bureau started keeping data.
Retail sales are a key portion of consumer spending and real retail sales have fallen off a cliff.
Thursday, December 11, 2008
Reports: Auto bailout talks collapse
by Calculated Risk on 12/11/2008 10:55:00 PM
From AP: Auto bailout talks collapse over union wages
From CNBC: Senate Fails to Reach Agreement on Auto Bailout
The U.S. Senate has failed to reach an agreement on a $14 billion government bailout to rescue the nation's Big Three automakers.Smells like bankruptcy ...
Senate Majority Leader Harry Reid said he was "terribly disappointed" as there was "too much difference" between negotiators to come to a compromise.
UPDATE: It will probably be ugly tomorrow.
Bloomberg Futures.
Index Futures from Barchart.com (active futures have a time not a date)
CBOT mini-sized Dow
The Madoff Complaint
by Calculated Risk on 12/11/2008 10:42:00 PM
This is pretty amazing (from the WSJ).
Here are the two key sections (plus Madoff apparently admitted everything to the FBI): Click on text for larger image in new window.
This section suggests Madoff only had a few clients (probably 10 to 25 hedge funds).  And this section suggests those hedge funds lost just about everything.
This sounds like a few hedge funds will take some serious write downs soon.


