 RSS Feed
 by Calculated Risk on 11/07/2006 04:14:00 PM
Tuesday, November 07, 2006
Credit Suisse: New Home Inventory Higher than Reported
Credit Suisse has estimated the actual inventory of New Home sales based on cancellations. First, for an excellent article on the impact of cancellations on reported New Home Inventories, see Caroline Baum at Bloomberg: Think Housing's Stabilized? See Cancellations
... cancellations are rising, and they aren't being captured in the aggregate statistics because of the way the survey is designed. Hence, sales are being overstated and inventories understated.From Credit Suisse today: "Inventory in the system is higher than reported."
...
The Census Bureau, which is one of the Commerce Department's statistical agencies, counts an initial new home sale: Sales go up and the ``for sale'' inventory is reduced. If the sale is canceled, it isn't reflected in revisions to previous months. What happens? When the home is ``resold,'' statisticians ignore that transaction.
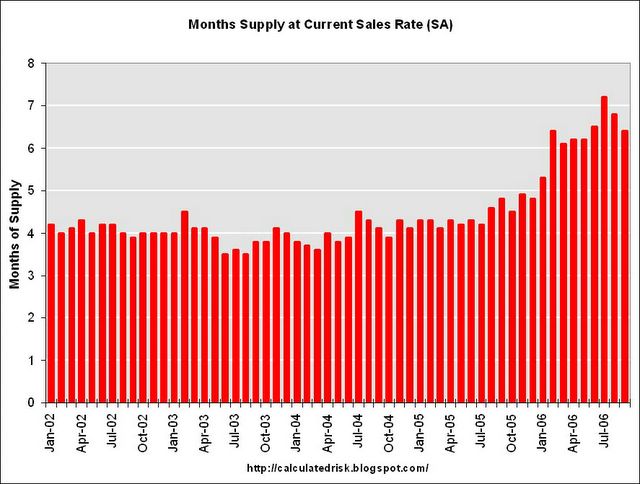 Click on Graph for larger image.
This graph shows the months of inventory based on the Census Bureau report. Based on Credit Suisse's analysis, the actual months of inventory is closer to 8 months. Note: Credit Suisse excludes non-started units.
State Nontraditional Mortgage Guidance Release Date
by Calculated Risk on 11/07/2006 03:24:00 PM
Update from the CSBS: The Conference of State Bank Supervisors (CSBS) hopes to release the State Nontraditional Mortgage Guidance on Tuesday November 14th.
I'll post a link to the guidance when it is released.
NY Times: A growing burden of home debt
by Calculated Risk on 11/07/2006 12:33:00 AM
From the AZ Central: A growing burden of home debt
Credit counselors are finding that mortgage debt is playing a bigger role in the deteriorating financial health of consumers contemplating bankruptcy.
...
[Susan C. Keating, chief executive of the National Foundation for Credit Counseling] said ... many counselors reported that their clients were delinquent on their mortgages, with some reporting that 100 percent of their clients were delinquent.
The organization's counselors ... had reported a brisk increase in the number of clients who are concerned about the rising costs of their adjustable-rate mortgages in particular, she said.
...
"Mortgage debt is coming out as much more significant than we expected," Keating said. "Pull this all together with the other unsecured debt people have, and this is really problematic."
...
But according to Craig Focardi, an analyst with TowerGroup, a financial industry consulting firm, federal bankruptcy laws passed last year could also help make it less likely that banks will push for foreclosures when consumers become delinquent with mortgages.
Focardi said that under the new bankruptcy law, secured creditors like mortgage lenders "have to share more of a debtor's income with credit card, automobile, and other consumer lenders that hope to increase collection recoveries" in a bankruptcy proceeding.
As a result, Focardi said, mortgage lenders are more likely to help consumers stave off bankruptcy by setting up payment recovery plans, because they may stand even less of a chance of getting repaid if the consumer declares bankruptcy now than they did under the previous laws.
"Under the new law it's harder for borrowers to file Chapter 7, which enables them to extinguish their debt," Focardi said. "Instead, they have to set up repayment plans even for credit cards. So it lengthens the amount of time borrowers are delinquent on their mortgages and could increase the lender's total loss on that defaulted loan."
Monday, November 06, 2006
UBS: Home Prices to Decline 10% in 2007
by Calculated Risk on 11/06/2006 04:53:00 PM
From MarketWatch: UBS sees home prices down 10% in 2007
Home prices will fall 10% on average in 2007 and it will likely take three years to clear out the huge inventory of empty unsold homes currently in the market, according to a UBS report released Monday.
Fed's Moskow on Housing
by Calculated Risk on 11/06/2006 04:30:00 PM
Chicago Fed President Michael H. Moskow spoke today on the U.S Economic Outlook. Moskow focused on the housing market:
Residential investment has fallen 7-1/2 percent year-to-date, and in the third quarter it shaved 1.1 percentage points off of GDP growth. Additionally, home prices have been rising more slowly and by some measures have even declined. These developments raise important questions for the economy as a whole: Will there be further declines in housing markets? And will the current and any further declines in housing lead to more general economic weakness?
Here, it's important to remember the positive longer-run fundamentals underpinning housing demand. Since the mid-1990s, the housing capital stock—which reflects the number of homes in the U.S. as well as their size and quality—has been growing about 3 percent per year on average.
This demand for housing has been supported by the step-up in productivity growth, which improved the long-run income prospects for Americans. Furthermore, financial innovations lowered borrowing costs and greatly increased access to credit. As a result, the homeownership rate in the U.S. has increased from 64 percent in the mid-1990s to 69 percent in 2005, with improvements across nearly all demographic and income groups. And many people have put their money into bigger and better homes. Between 1995 and 2005, the size of a typical new home increased nearly 20 percent, and many homeowners invested in home improvements and renovations.
Nonetheless, with underlying housing demand growing 3 percent per year, the large gains in residential investment—which averaged 8-1/2 percent per year between 2001 and 2005—clearly could not continue indefinitely. Moreover, housing demand may slow to less than 3 percent, as demographics point to slower growth in household formation. As a result, we at the Chicago Fed expect some further weakness in residential construction.
By themselves, the declines in residential investment could contribute to some volatile numbers for overall GDP growth, as we saw in the third quarter. But their direct impact on the economy is limited by the relative size of residential investment. Home construction is on average only about 5 percent of GDP—that's about the same as people spend on recreation items such as books, golf clubs, and tickets to theater and opera.
 Click on graph for larger image.
Moskow is correct that residential investment is on average around 5% of GDP (actually the median was 4.5% during the last 35 years). However, residential investment (RI) has recently fallen to 5.7% of GDP from the peak of 6.3% in the second half of 2005. So if RI falls back to the median level of the last 35 years (4.5% of GDP), the decline in RI has just started.
In order to generate more general economic weakness, the housing slowdown would have to spill over into other sectors of the economy. One avenue for this to occur is through home prices. We all know that home prices have soared during the past five years. The factors that caused fundamental increases in the demand for housing should be reflected to some degree in higher home prices. But there is still a risk that prices have also been boosted by factors unrelated to demand fundamentals. If that is the case, prices in some regions could unwind and reduce residential construction. And the negative wealth effects from softening house prices could reduce consumption more than anticipated.
Currently, we do not see the slowing in housing markets spilling over into a more prolonged period of weakness in the U.S. economy overall. On balance, the 95 percent of the economy outside of housing remains on good footing. emphasis added
Roubini on CNBC and more
by Calculated Risk on 11/06/2006 11:54:00 AM
From Roubini: Desperate Realtors... Desperate Retailers... Desperate Housewives...
"It is a lousy time to buy as prices are falling - at an annualized rate of 10% for new homes - and they will be falling another 20 to 30% in the next two-three years as the glut of housing and the bust in the housing market unravels: which fool would buy a home now when a 20% down-payment and the entire equity in such down-payment will be altogether wiped out by a fall in home prices in the next few years? Anyone buying today at the still stratospheric prices will destroy his/her home equity in short order."Reuters reports the opposite view: Greenspan: more housing weakness ahead, worst over
The U.S. housing market will weaken further, but the sharpest decline is over as inventories of unsold homes decrease, Former Federal Reserve Chairman Alan Greenspan said on Monday.And Morgan Stanley's Stephen Jen (whom Brad Setser calls the "anti-Roubini") writes: The Risk of a Recession Within 12 months is Now Only 13%
"This is not the bottom, but the worst is behind us," Greenspan said at a conference organized by financial services firm Charles Schwab.
...
A decline in U.S. home sales and construction has contributed to an overall slowing of economic growth to 1.6 percent in third quarter. But Greenspan said housing activity is likely no longer to be a drag on overall economic growth as unsold inventories clear out and stabilize against sales levels.
The former central banker said he is "reasonably confident" the United States will not slide into recession because businesses appear to be strong, as evinced by strong corporate profit margins and healthy levels of capital investment.
"Overall, we remain comfortable with the view that the bond markets over-reacted to the slowdown in the housing markets, and that the structural US bears may have gotten ahead of themselves in predicting a recession in the US."
 Click on graph for larger image.
 Right now it seems like many people are bearish, mostly because the relatively few bears are very noisy and ubiquitous lately. Even though the bear camp is growing, the overwhelming consensus is still for a soft landing (Greenspan, Jen, etc.). The consensus view is GDP will rebound in Q4 and be slightly below trend in 2007. This graph from the FDIC shows the Blue Chip Forecast consensus.
This comment from Setser is an excellent observation:
"The dispersion in credible views about the likely course of the US economy is unusually large."And mostly the difference in views comes down to the impact of the housing bust on the general economy. I think how people view the housing bust, depends on how they viewed the housing boom. Those that felt there was excessive speculation in the housing market (the definition of a bubble) believe that the housing bust has just started. Those that felt the boom was mostly based on fundamentals, with a little "froth", think the bust is almost over.
Obviously I believe there was excessive speculation, so I think the bust has a long way to go.
Monopoly: Housing Bust Edition
by Calculated Risk on 11/06/2006 12:04:00 AM
 Click on image for larger version.
Image from Aaron Erimez. (Hat tip: Satellite Sky)
Enjoy!
Sunday, November 05, 2006
Schwab Chart: Builder Confidence vs. S&P 500
by Calculated Risk on 11/05/2006 01:57:00 PM
Several people have sent me the chart in this CNNMoney article: Can the Economy Survive the Housing Bust?

It turns out that the mood of builders is a terrific stock market bellwether: The correlation between current builder confidence and future stock market returns over the past ten years is downright unnerving.This is an example of a forced correlation. By picking a certain time period, and adjusting the scales, the correlation looks very strong.
Not only did the NAHB index presage the start of the post-1994 bull market in stocks, but its decline starting in 1999 foreshadowed the equity market collapse that came the following year. Builder confidence rebounded in November 2001 - a year ahead of the stock market upswing that began in October 2002.
Why is Sonders worried now? Just look at the chart. Over the past year, the NAHB housing index plummeted 54 percent. Were stocks to follow suit, the S&P - 1400 in late October - would be trading below 700 this time next year.
 Click on graph for larger image.
But here is a comparison over a longer period - since 1985 when the NAHB Builder confidence index was introduced. In the long run, Builder confidence moves between about 20 and 70, whereas the S&P 500 trends higher. So the comparison breaks down over a longer period.
To compare these two series, it would be better to compare the YoY change.
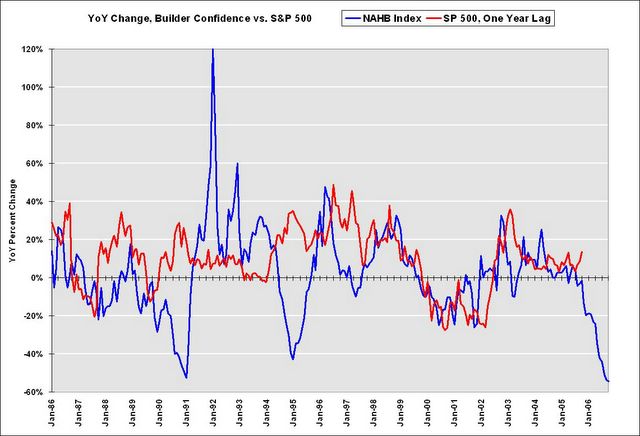
This graphs shows that the YoY changes have tracked closely (with a one year lag for the S&P 500) for the last 10 years, but in earlier years there was very little correlation between stocks and builder confidence.
Once again, I don't like the way the chart was presented, and I don't think there is a long term correlation between the two series.
Saturday, November 04, 2006
NY Times: Incorrect chart on MEW
by Calculated Risk on 11/04/2006 06:29:00 PM
The following chart is from the NY Times article: Mortgage Lesson No. 1: Home Is Not a Piggy Bank Click on image for full chart.
From the article:
"In the first six months of this year, even with interest rates rising, more than $511 billion was extracted from homes through cash-out refinancing and home equity loans, and that was more than the amount taken out for all of 2005, a record year for mortgage equity extraction."This is not correct. From the Federal Reserve Flow of Funds report, mortgage debt (including home equity loans) increased a total of $436.4 Billion in the first 6 months of 2006. Total household mortgage debt was $9,324.5 Billion on June 30, 2006 as compared to $8,888.1 Billion on Dec 31, 2005. (See line 32 in linked Fed report). Line 32 includes "loans made under home equity lines of credit and home equity loans secured by junior liens."
And that is total mortgage debt. To calculate MEW, household investment in housing has to be subtracted from the increase in total mortgage debt. This includes investment in new homes, home improvements, and various taxes and fees.
The following table is a comparison between the NY Times numbers and my estimates of MEW:
| MEW Comparison: NY Times vs. CR (billions) | ||
| Year | NY Times | CR estimate |
| 2001 | $210 | $156 |
| 2002 | $260 | $331 |
| 2003 | $410 | $453 |
| 2004 | $458 | $504 |
| 2005 | $483 | $540 |
| 2006 (first half) | $511 | $156 |
In general the estimates are fairly close. However the NY Times estimate for 2006 appears to be incorrect.
Friday, November 03, 2006
Unemployment Rate vs. Recessions
by Calculated Risk on 11/03/2006 10:42:00 PM
In the comments to the previous post, ac suggests we "would expect to see the unemployment rate drop to a new low just prior to a recession". This is historically correct. Click on graph for larger image.
Historically the unemployment rate has no predictive value. It does not rise right before a recession - in fact it is common for the unemployment rate to set a new low right before a recession starts. Of course, just because the unemployment rate has hit a new low, doesn't mean a recession is imminent either!
The bottom line is the unemployment rate has no predictive value. It is simply a coincident indicator.

In Memoriam: Doris "Tanta" Dungey


| Privacy Policy |
| Copyright © 2007 - 2025 CR4RE LLC |
| Excerpts NOT allowed on x.com |