 RSS Feed
 by Calculated Risk on 11/05/2006 01:57:00 PM
Sunday, November 05, 2006
Schwab Chart: Builder Confidence vs. S&P 500
Several people have sent me the chart in this CNNMoney article: Can the Economy Survive the Housing Bust?

It turns out that the mood of builders is a terrific stock market bellwether: The correlation between current builder confidence and future stock market returns over the past ten years is downright unnerving.This is an example of a forced correlation. By picking a certain time period, and adjusting the scales, the correlation looks very strong.
Not only did the NAHB index presage the start of the post-1994 bull market in stocks, but its decline starting in 1999 foreshadowed the equity market collapse that came the following year. Builder confidence rebounded in November 2001 - a year ahead of the stock market upswing that began in October 2002.
Why is Sonders worried now? Just look at the chart. Over the past year, the NAHB housing index plummeted 54 percent. Were stocks to follow suit, the S&P - 1400 in late October - would be trading below 700 this time next year.
 Click on graph for larger image.
But here is a comparison over a longer period - since 1985 when the NAHB Builder confidence index was introduced. In the long run, Builder confidence moves between about 20 and 70, whereas the S&P 500 trends higher. So the comparison breaks down over a longer period.
To compare these two series, it would be better to compare the YoY change.
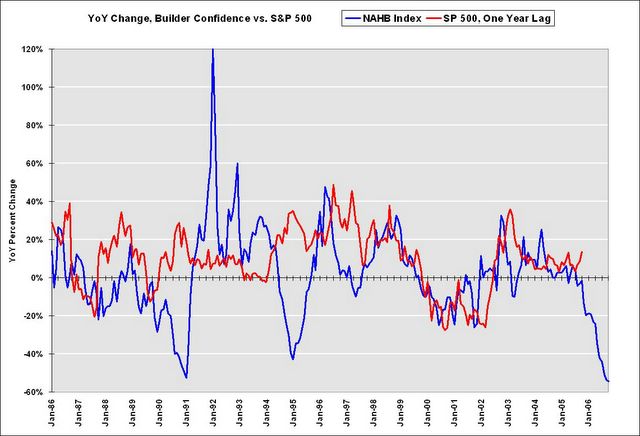
This graphs shows that the YoY changes have tracked closely (with a one year lag for the S&P 500) for the last 10 years, but in earlier years there was very little correlation between stocks and builder confidence.
Once again, I don't like the way the chart was presented, and I don't think there is a long term correlation between the two series.


