by Calculated Risk on 2/03/2012 10:54:00 AM
Friday, February 03, 2012
Employment Summary, Part Time Workers, and Unemployed over 26 Weeks
This was a solid report and well above expectations. However there is still a long ways to go for a healthy labor market with solid wage gains.
There were 243,000 payroll jobs added in January, with 257,000 private sector jobs added, and 14,000 government jobs lost. The unemployment rate fell to 8.3% from 8.5% in December. U-6, an alternate measure of labor underutilization that includes part time workers and marginally attached workers, declined to 15.1%. This remains very high - U-6 was in the 8% range in 2007.
The annual benchmark revision indicated 165,000 more payroll jobs in March 2011; the first positive benchmark revision since 2006. The BLS also adjusted the population control by the Census 2010 data. This resulted in a large increase in the labor force and an even larger increase in the "not in the labor force" category.
However - in the not good news category - the participation rate declined to 63.7% and the employment population ratio was unchanged in January at 58.5%.
The average workweek was unchanged at 34.4 hours, and average hourly earnings increased 0.2%. "The average workweek for all employees on private nonfarm payrolls was unchanged in January. ... In January, average hourly earnings for all employees on private nonfarm payrolls rose by 4 cents, or 0.2 percent, to $23.29. Over the past 12 months, average hourly earnings have increased by 1.9 percent." This is sluggish earnings growth, and earnings are still being impacted by the large number of unemployed and marginally employed workers.
There are a total of 12.8 million Americans unemployed and 5.5 million have been unemployed for more than 6 months. Still very grim.
Overall this was a solid report, but still not enough given the slack in the economy.
Percent Job Losses During Recessions
 Click on graph for larger image.
This graph shows the job losses from the start of the employment recession, in percentage terms - this time aligned at maximum job losses.
In the previous post, the graph showed the job losses aligned at the start of the employment recession.
Part Time for Economic Reasons
 From the BLS report:
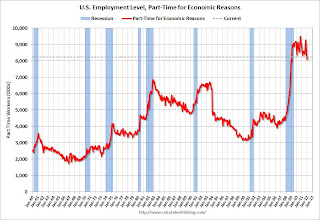
The number of persons employed part time for economic reasons, at 8.2 million, changed little in January. These individuals were working part time because their hours had been cut back or because they were unable to find a full-time job.The number of part time workers increased slightly in January and is still very high.
These workers are included in the alternate measure of labor underutilization (U-6) that declined to 15.1% in January from 15.2% in December.
Unemployed over 26 Weeks
 This graph shows the number of workers unemployed for 27 weeks or more.
 According to the BLS, there are 5.518 million workers who have been unemployed for more than 26 weeks and still want a job. This was down from 5.588 million in November. This is very high, but this is the lowest number since September 2009. Long term unemployment remains a serious problem.
More graphs coming ...
Graphs: Unemployment Rate, Participation Rate, Jobs added
by Calculated Risk on 2/03/2012 09:24:00 AM
There were some revisions this morning to previous employment reports. This included the annual benchmark revision to state unemployment insurance (UI) records, and benchmarking the population controls to the 2010 Census data and an update to seasonal factors.
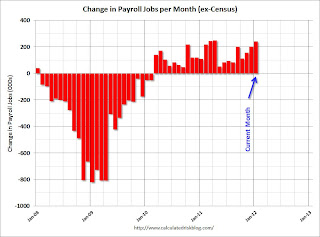
The benchmark revision increased total employment in March 2011 by 165,000 jobs - the first positive benchmark revision since 2006.
This graph shows the jobs added or lost per month (excluding temporary Census jobs) since the beginning of 2008.
 Click on graph for larger image.
Job growth started picking up early last year, but then the economy was hit by a series of shocks (oil price increase, tsunami in Japan, debt ceiling debate) - and now it appears job growth is picking up again.
The second graph shows the employment population ratio, the participation rate, and the unemployment rate. The unemployment rate declined to 8.3% (red line).
 The Labor Force Participation Rate declined to 63.7% in January (blue line). This is the percentage of the working age population in the labor force and is at the lowest since the early '80s. The decline in the participation rate is not good news even though it is pushing down the unemployment rate. The participation rate is well below the 66% to 67% rate that was normal over the last 20 years, although some of the decline is due to the aging population.
The Employment-Population ratio was unchanged at 58.5% in January (black line).
 The third graph shows the job losses from the start of the employment recession, in percentage terms. The dotted line is ex-Census hiring.
This shows the depth of the recent employment recession - much worst than any other post-war recession - and the relatively slow recovery due to the lingering effects of the housing bust and financial crisis.
This was a relatively strong report and well above consensus expectations. I'll have much more soon ...
January Employment Report: 243,000 Jobs, 8.3% Unemployment Rate
by Calculated Risk on 2/03/2012 08:30:00 AM
From the BLS:
Total nonfarm payroll employment rose by 243,000 in January, and the unemployment rate decreased to 8.3 percent, the U.S. Bureau of Labor Statistics reported today. Job growth was widespread in the private sector, with large employment gains in professional and business services, leisure and hospitality, and manufacturing. Government employment changed little over the month. ... Private-sector employment grew by 257,000 ...This was the first positive benchmark revision since 2006. There were several revisions, and I'll have graphs soon, but this was solidly above expectations.
The change in total nonfarm payroll employment for November was revised from +100,000 to +157,000, and the change for December was revised from +200,000 to +203,000.
[and on benchmark revision] The total nonfarm employment level for March 2011 was revised upward by 165,000.
Thursday, February 02, 2012
Mortgage Rates fall to record low
by Calculated Risk on 2/02/2012 10:21:00 PM
Probably worth a mention - especially since refinance activity will probably pick up soon (I expect HARP to increase in March) ...
From Freddie Mac: Average Mortgage Rates Ease Setting New Record Lows
Freddie Mac today released the results of its Primary Mortgage Market Survey® (PMMS®), showing average mortgage rates dropping to new all-time record lows as data on economic growth fell short of market projections. All products in the PMMS survey, except the 1-Year ARM, averaged new lows.This is the lowest 30 year fixed rate since Freddie Mac started tracking rates in 1971. Rates were pretty low in the early 50s too - if anyone has a source for mortgage rates back then, please let me know.
...
30-year fixed-rate mortgage (FRM) averaged 3.87 percent with an average 0.8 point for the week ending February 2, 2012, down from last week when it averaged 3.98 percent. Last year at this time, the 30-year FRM averaged 4.81 percent.
...
5-year Treasury-indexed hybrid adjustable-rate mortgage (ARM) averaged 2.80 percent this week, with an average 0.7 point, down from last week when it averaged 2.85 percent. A year ago, the 5-year ARM averaged 3.69 percent.
Lawler: Home Builder Results for Last Quarter
by Calculated Risk on 2/02/2012 06:31:00 PM
From economist Tom Lawler:
Of the nine large publicly traded home builders whose fiscal quarters end on the same day as calendar quarters, eight have published earnings and operating stats. I don’t comment on earnings, put below are some selected stats on orders, settlements, and order backlogs.
Pulte, of course, noted that in the quarter ended December 31, 2010 there was a “one-time pickup” of about 200 net orders “associated with a change in the Company’s order recognition process,” and that as of result a “like-to-like” comparison of the latest quarter vs. the comparable year-ago quarter would show a YOY gain of “about” 8%. Adjusting the totals for all eight builders for the “Pulte shift,” the YOY gain in net orders for the above group would be 13.3% (and the YOY decline for the previous year would be 16.7%). For these eight companies combined, the backlog of orders at the end of last year was up 18.1% from the end of 2010, though it was little changed from the end of 2009.
| Settlements | Net Orders | Backlog | |||||||
|---|---|---|---|---|---|---|---|---|---|
| End 2011 | End 2010 | End 2009 | End 2011 | End 2010 | End 2009 | End 2011 | End 2010 | End 2009 | |
| D.R. Horton | 4,118 | 3,637 | 5,529 | 3,794 | 3,363 | 4,037 | 4,530 | 3,854 | 4,136 |
| PulteGroup | 4,303 | 4,405 | 6,200 | 3,084 | 3,044 | 3,748 | 3,924 | 3,984 | 5,931 |
| NVR | 2,391 | 2,639 | 2,550 | 2,158 | 1,765 | 2,000 | 3,676 | 2,916 | 3,531 |
| The Ryland Group | 1,040 | 909 | 1,666 | 915 | 775 | 969 | 1,514 | 1,187 | 1,732 |
| Meritage Homes | 894 | 837 | 1,202 | 749 | 713 | 621 | 915 | 778 | 1,095 |
| Beazer Homes | 882 | 549 | 961 | 724 | 553 | 728 | 1,309 | 800 | |
| MDC Holdings | 950 | 865 | 1,109 | 523 | 519 | 637 | 1,043 | 842 | 826 |
| M/I Homes | 667 | 650 | 858 | 505 | 460 | 448 | 676 | 532 | 650 |
| Total | 15,245 | 14,491 | 20,075 | 12,452 | 11,192 | 13,188 | 17,587 | 14,893 | 17,901 |
| YoY % Change | 5.2% | -27.8% | 11.3% | -15.1% | 18.1% | -16.8% | |||
MDC Holdings, by the way, reported that January 2012 net sales were up “about 30%” from January 2011 sales.
Census new SF home sales data showed a YOY increase in sales for the fourth quarter of 2011 (NSA, of course), of just 3.0%, while the YOY % decline for Q4/10 was 20.5%. Unfortunately, the Census new SF sales data are not directly comparable to reports from home builders, partly because of the treatment of sales cancellations, and partly because the timing of a “sale” can differ slightly. As such, it’s difficult to ascertain the degree to which “large” builder sales gains have exceeded Census’ gains reflects market share gains, different reporting, or “bad” Census data!
Net, though, my gut is that the large builders were seeing better net orders last quarter than Census new home sales data might have suggested.


