 RSS Feed
 by Calculated Risk on 2/11/2019 04:49:00 PM
Monday, February 11, 2019
Tuesday: Job Openings, Q4 Quarterly Report on Household Debt and Credit
From Matthew Graham at Mortgage News Daily: Low Rates Unfazed by a Bit of Market Weakness
Mortgage rates held their ground fairly well today, despite the fact that underlying bond markets were weaker.Tuesday:
...
All of the nuts and bolts above notwithstanding, the average lender remains in line with the lowest rates in a year. Only January 31st saw anything better, and it wasn't much better! [30YR FIXED 4.375 - 4.5%]
emphasis added
• At 6:00 AM ET, NFIB Small Business Optimism Index for January.
• At 10:00 AM, Job Openings and Labor Turnover Survey for December from the BLS. Jobs openings decreased in November to 6.888 million from 7.131 million in October.
• At 11:00 AM, NY Fed: Q4 Quarterly Report on Household Debt and Credit
• At 12:45 PM, Speech by Fed Chair Jerome Powell, Economic Development in High Poverty Rural Communities, At the Hope Enterprise Corporation Rural Policy Forum, Itta Bena, Miss.
"As more older Americans 'age in place,' millennials struggle to find homes"
by Calculated Risk on 2/11/2019 02:55:00 PM
Diana Olick at CNBC has an interesting article: As more older Americans 'age in place,' millennials struggle to find homes
With more seniors than ever aging in place and choosing not to sell the family home, an estimated 1.6 million fewer properties are now available in a market already experiencing a critical shortage, according to Freddie Mac.CR Note: If the Boomer's follow the behavior of the previous generations, many will stay in their homes ("age in place") until they are in their '80s (some until they pass away). Since the leading edge of the Boomer generation is only about 75 right now, it will still be a number of years before a large number of older people will move to retirement communities.
…
"We believe the additional demand for homeownership from seniors aging in place will increase the relative price of owning versus renting, making renting more attractive to younger generations," said Sam Khater, chief economist at Freddie Mac, who estimates that the current market needs about 2.5 million more homes to meet demand.
And, even when people move to retirement communities, many will not sell their homes. They will rent them instead - especially in the higher priced areas with significant capital gains - since they have to pay capital gains if they sell (above $250K exclusion for single, $500K for married), but the property steps up in value when they pass away. So they can leave the property to their kids with no taxes.
This could be fixed with policy changes. Either eliminate "step up" basis (take away the incentive to hold), or give older homeowners a one time unlimited exclusion (so they can sell while they are alive).
Aging in place is great for the senior, but what frequently happens, is a four bedroom house is occupied by just one person (inefficient). This is another area where zoning changes could help - let the senior sell her larger family home without tax consequences, and move to a smaller home in the same community (so they can keep their local ties).
Goldman: When Will Inflation Rise Above 2%?
by Calculated Risk on 2/11/2019 12:27:00 PM
A few excerpts from a research note by Goldman Sachs economists David Choi and David Mericle: US Daily: When Will Inflation Rise Above 2%? A View from Our Bottom-Up Model
In its January statement, the FOMC highlighted “muted inflation pressures” as a key reason to be patient in making future adjustments to interest rates. This new language further raises the burden on the inflation data to justify any potential rate hikes later this year.
Our bottom-up core PCE inflation model now projects a rise to 2.1% by end-2019. ... But the bounce above 2% is unlikely to come until the August report, not available until the FOMC’s October meeting. This adds a bit to the case for Q4 as the most likely timing of the next hike.
Oil: Rig Counts Rebounded
by Calculated Risk on 2/11/2019 10:13:00 AM
A few comments from Steven Kopits of Princeton Energy Advisors LLC on February 8, 2019:
• Oil rig counts rebounded, +7 to 854. Not surprising given last week’s big fall.
• Horizontal oil rig counts fell, -1 to 758
• The Permian lost 3, other plays were largely flat
• Breakeven to add rigs rose to $58.50 WTI compared to $52.70 WTI on the screen as of the writing of this report.
• On paper, we should see a big roll-off in rigs next week.
 Click on graph for larger image.
CR note: This graph shows the US horizontal rig count by basin.
Graph and comments Courtesy of Steven Kopits of Princeton Energy Advisors LLC.
Sunday, February 10, 2019
Sunday Night Futures
by Calculated Risk on 2/10/2019 07:24:00 PM
Weekend:
• Schedule for Week of February 10, 2019
Monday:
• No major economic releases scheduled.
From CNBC: Pre-Market Data and Bloomberg futures: S&P 500 and DOW futures are mostly unchanged (fair value).
Oil prices were down over the last week with WTI futures at $52.44 per barrel and Brent at $61.89 per barrel. A year ago, WTI was at $59, and Brent was at $62 - so oil prices are down year-over-year.
Here is a graph from Gasbuddy.com for nationwide gasoline prices. Nationally prices are at $2.29 per gallon. A year ago prices were at $2.58 per gallon, so gasoline prices are down 29 cents per gallon year-over-year.
Hotels: Occupancy Rate Increased Slightly Year-over-year
by Calculated Risk on 2/10/2019 10:32:00 AM
From HotelNewsNow.com: STR: US hotel results for week ending 2 February
The U.S. hotel industry reported positive year-over-year results in the three key performance metrics during the week of 27 January through 2 February 2019, according to data from STR.The following graph shows the seasonal pattern for the hotel occupancy rate using the four week average.
In comparison with the week of 28 January through 3 February 2018, the industry recorded the following:
• Occupancy: +0.1% to 56.7%
• Average daily rate (ADR): +2.3% to US$124.95
• Revenue per available room (RevPAR): +2.4% to US$70.83
STR analysts note that results were more stabilized than in recent weeks as the government shutdown ended.
emphasis added
 Click on graph for larger image.
The red line is for 2019, dash light blue is 2018, blue is the median, and black is for 2009 (the worst year probably since the Great Depression for hotels).
A solid start for 2019.
Seasonally, the occupancy rate will increase over the next couple of months.
Data Source: STR, Courtesy of HotelNewsNow.com
Saturday, February 09, 2019
Schedule for Week of February 10, 2019
by Calculated Risk on 2/09/2019 08:11:00 AM
The key reports this week are January CPI and December retail sales.
For manufacturing, the January Industrial Production report and the February NY Fed manufacturing survey will be released.
No major economic releases scheduled.
6:00 AM ET: NFIB Small Business Optimism Index for January.
 10:00 AM ET: Job Openings and Labor Turnover Survey for December from the BLS.
 This graph shows job openings (yellow line), hires (purple), Layoff, Discharges and other (red column), and Quits (light blue column) from the JOLTS.
Jobs openings decreased in November to 6.888 million from 7.131 million in October.
The number of job openings (yellow) were up 16% year-over-year, and Quits were up 7% year-over-year.
11:00 AM: NY Fed: Q4 Quarterly Report on Household Debt and Credit
12:45 PM: Speech by Fed Chair Jerome Powell, Economic Development in High Poverty Rural Communities, At the Hope Enterprise Corporation Rural Policy Forum, Itta Bena, Miss.
7:00 AM ET: The Mortgage Bankers Association (MBA) will release the results for the mortgage purchase applications index.
8:30 AM: The Consumer Price Index for January from the BLS. The consensus is for 0.1% increase in CPI, and a 0.2% increase in core CPI.
8:30 AM: The initial weekly unemployment claims report will be released. The consensus is for 225 thousand initial claims, down from 234 thousand the previous week.
8:30 AM: The Producer Price Index for January from the BLS. The consensus is for a 0.2% increase in PPI, and a 0.2% increase in core PPI.
 8:30 AM: Retail sales for December is scheduled to be released. The consensus is for a 0.1% increase in retail sales.
This graph shows the year-over-year change in retail sales and food service (ex-gasoline) since 1993. Retail and Food service sales, ex-gasoline, increased by 3.6% on a YoY basis.
8:30 AM: The New York Fed Empire State manufacturing survey for February. The consensus is for a reading of 7.0, up from 3.9.
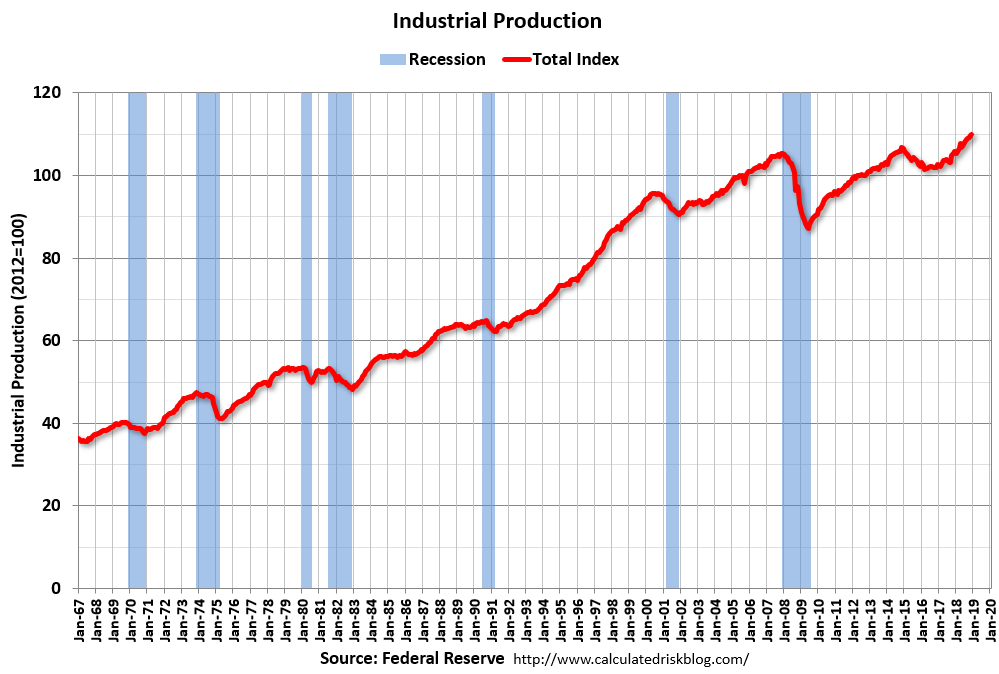 9:15 AM: The Fed will release Industrial Production and Capacity Utilization for January.
This graph shows industrial production since 1967.
The consensus is for a 0.2% increase in Industrial Production, and for Capacity Utilization to increase to 78.8%.
10:00 AM: University of Michigan's Consumer sentiment index (Preliminary for February). The consensus is for a reading of 92.5.
Friday, February 08, 2019
Q4 GDP Forecasts: Mid-2s
by Calculated Risk on 2/08/2019 04:09:00 PM
The BEA has announced that the Q4 advanced GDP report will be combined with the 2nd estimate of GDP, and will be released on Feb 28th.
From Merrill Lynch:
Better than expected trade data were offset by soft manufacturing inventories data, leaving our 4Q tracking estimate unchanged at 2.3%. [Feb 8 estimate]From the NY Fed Nowcasting Report
emphasis added
The New York Fed Staff Nowcast stands at 2.4% for 2018:Q4 and 2.2% for 2019:Q1. [Feb 8 estimate]And from the Altanta Fed: GDPNow
The GDPNow model estimate for real GDP growth (seasonally adjusted annual rate) in the fourth quarter of 2018 is 2.7 percent on February 6, up from 2.5 percent on February 1. [Feb 6 estimate]CR Note: These estimates suggest GDP in the mid 2s for Q4.
AAR: January Rail Carloads up 1.7% YoY, Intermodal Up 0.5% YoY
by Calculated Risk on 2/08/2019 10:32:00 AM
From the Association of American Railroads (AAR) Rail Time Indicators. Graphs and excerpts reprinted with permission.
Total U.S. rail carloads were up 1.7%, or 21,054 carloads, in January 2019 over January 2018, while U.S. intermodal volume was up 0.5%, or 6,008 containers and trailers. You can split the five weeks of January 2019 into two parts. In weeks 1-3, total carloads were up 8.1% over last year and intermodal was up 5.7%. In weeks 4-5, though, carloads were down 6.6% (including an 8.4% decline in week 5) and intermodal was down 6.5% (including a 9.6% decline in week 5). Clearly, harsh weather at the end of January hurt rail traffic.
emphasis added
 Click on graph for larger image.
This graph from the Rail Time Indicators report shows U.S. average weekly rail carloads (NSA). Red is 2019.
Rail carloads have been weak over the last decade due to the decline in coal shipments.
U.S. railroads (excluding the U.S. operations of Canadian railroads) originated 1.238 million carloads in January 2019, up 1.7%, or 21,054 carloads, over January 2018. Weekly average total carloads in January 2019 were 247,697, the fewest for any month since January 2018.
In terms of rail carloads, January (which consists of weeks 1-5) had two parts. For weeks 1-3, total carloads were up 8.1% this year over last year. For weeks 4-5, though, they were down 6.6%. The extreme cold this year at the end of January in many parts of the country limited rail operations substantially, though it’s impossible to precisely calculate what carloads would have been if weather had been more normal.
 The second graph is for intermodal traffic (using intermodal or shipping containers):
In addition to carloads, U.S. railroads originated 1.316 million containers and trailers in January 2019, up 0.5% over January 2018. Weekly average intermodal volume in January 2019 was 263,234 units, the most ever for January.Traffic in 2019 was off to a strong start, but then declined sharply due to the weather. AAR expects some "make-up volume" in February.
Like carloads, intermodal suffered from the weather. In the first three weeks of 2019, intermodal volume was up 5.7% over last year; weeks 2 and 3 this year were the highest-volume intermodal weeks in January in history for U.S. railroads. In weeks 4-5, though, intermodal was down 6.5% this year over last year, including a 9.6% decline in week 5, when weather was especially cold in much of the country. Again, it’s not possibly to precisely quantify the impact, but it’s reasonable to expect some make-up volume in February.
Seattle Real Estate in January: Sales Unchanged YoY, Inventory up 168% YoY from Low Levels
by Calculated Risk on 2/08/2019 10:16:00 AM
The Northwest Multiple Listing Service reported Homebuyers resuming search amid improving inventory, attractive terms
KIRKLAND, Washington (February 7, 2019) - Home buyers around Washington state are making their way back to the market, hoping to take advantage of improving inventory, attractive interest rates, and more approachable sellers, according to officials with Northwest Multiple Listing Service.The press release is for the Northwest. In King County, sales were down 3.7% year-over-year, and active inventory was up 144% year-over-year.
Northwest MLS statistics for January show year-over-year improvement in the volume of new listings and total inventory, along with moderating selling prices. Although fewer pending sales (mutually accepted offers) were reported than a year ago (down about 3.3 percent), January was the smallest year-over-year decline since May 2018 when the drop was about 2.7 percent.
Commenting on the MLS statistics summarizing last month's activity, broker Gary O'Leyar said January's post-holiday real estate activity doesn't normally pick up until later in the month, but this year the uptick began early. "January started as a bit of a surprise. Open house activity was very robust, and we saw multiple offers in numerous instances again," reported O'Leyar, the owner of Berkshire Hathaway HomeServices Signature Properties in Seattle.
MLS members added 7,090 new listings of single family homes and condos during January, up from the year-ago figure of 6,805 and nearly doubling December's total of 3,631. At month end there were 11,687 active listings in the database, up more than 45 percent from the year-ago total of 8,037. Listing inventory more than doubled in both King and Snohomish counties.
emphasis added
In Seattle, sales were unchanged year-over-year, and inventory was up 168% year-over-year from very low levels. This is another market with inventory increasing sharply year-over-year, but months-of-supply in Seattle is still on the low side at 2.4 months.


