 RSS Feed
 by Calculated Risk on 12/20/2021 09:00:00 PM
Monday, December 20, 2021
"Mortgage Rates Moderately Higher"
From Matthew Graham at Mortgage News Daily: Mortgage Rates Start Lower, But Could See Some Volatility This Week
For most lenders, mortgage rates edged slightly higher at the start of the holiday-shortened week. The exception would be among those lenders who made changes to their rate offerings on Friday afternoon in response to deteriorating market conditions. The unequivocal comparison would be with Friday morning's rates, in which case today's rates are higher.From CR on COVID (mostly focus on hospitalizations and deaths):
...
Looking ahead, the bond market will be closed on Friday and open for only a half day on Thursday. Most mortgage lenders will not be updating rate sheets on Friday, and they will shy away from making big changes on Thursday unless massive market movement forces their hand.[30 year fixed 3.17%]
emphasis added
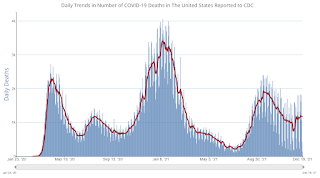
The CDC is the source for all data.
| COVID Metrics | ||||
|---|---|---|---|---|
| Today | Week Ago | Goal | ||
| Percent fully Vaccinated | 61.5% | --- | ≥70.0%1 | |
| Fully Vaccinated (millions) | 204.1 | --- | ≥2321 | |
| New Cases per Day3🚩 | 132,659 | 117,521 | ≤5,0002 | |
| Hospitalized3🚩 | 58,793 | 57,585 | ≤3,0002 | |
| Deaths per Day3🚩 | 1,169 | 1,131 | ≤502 | |
| 1 Minimum to achieve "herd immunity" (estimated between 70% and 85%). 2my goals to stop daily posts, 37-day average for Cases, Currently Hospitalized, and Deaths 🚩 Increasing 7-day average week-over-week for Cases, Hospitalized, and Deaths ✅ Goal met. | ||||
 Click on graph for larger image.
This graph shows the daily (columns) and 7-day average (line) of deaths reported.
LA Area Port Traffic: Disappointing Traffic in November
by Calculated Risk on 12/20/2021 05:50:00 PM
Notes: The expansion to the Panama Canal was completed in 2016 (As I noted a few years ago), and some of the traffic that used the ports of Los Angeles and Long Beach is probably going through the canal. This might be impacting TEUs on the West Coast.
Also, incoming port traffic is backed up significantly in the LA area with numerous ships at anchor waiting to unload.
Container traffic gives us an idea about the volume of goods being exported and imported - and usually some hints about the trade report since LA area ports handle about 40% of the nation's container port traffic.
The following graphs are for inbound and outbound traffic at the ports of Los Angeles and Long Beach in TEUs (TEUs: 20-foot equivalent units or 20-foot-long cargo container).
To remove the strong seasonal component for inbound traffic, the first graph shows the rolling 12-month average.
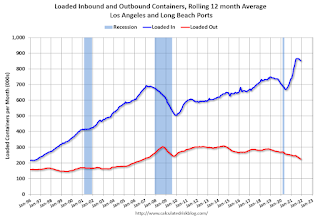
On a rolling 12-month basis, inbound traffic was down 0.8% in November compared to the rolling 12 months ending in October. Outbound traffic was down 2.0% compared to the rolling 12 months ending the previous month.
The 2nd graph is the monthly data (with a strong seasonal pattern for imports).

2021 started off incredibly strong for imports - and with the backlog of ships, will likely stay strong into 2022 (no break again in February or March).
It is disappointing that traffic dipped in November compared to the previous months so there are quite a few ships still waiting to unload.
Imports were down 10% YoY in November, and exports were down 22% YoY.
Supply Chain Disruptions and Housing Inventory
by Calculated Risk on 12/20/2021 05:40:00 PM
Today, in the Real Estate Newsletter: Supply Chain Disruptions and Housing Inventory
Excerpt:
An interesting question: Is how many of these units under construction are due to supply chain constraints. Census will release data next year on the length of time from start to completion, and that will probably show long delays in 2021. In 2020, it took an average of 6.8 months from start to completion for single family homes, and 15.4 months for buildings with 2 or more units.
For single family homes, starts have been at about the same level for over a year, so - in normal times - we’d expect completions to be at about the same level as starts. With some simple calculations, it seems that supply chain issues have delayed the completion of somewhere between 70,000 and 150,000 single family homes that would have normally been completed by November.
MBA Survey: "Share of Mortgage Loans in Forbearance Decreases to 1.67%"
by Calculated Risk on 12/20/2021 04:00:00 PM
Note: This is as of November 30th.
From the MBA: MBA Loan Monitoring Survey: Share of Mortgage Loans in Forbearance Decreases to 1.67%
The Mortgage Bankers Association’s (MBA) new monthly Loan Monitoring Survey revealed that the total number of loans now in forbearance decreased by 39 basis points from 2.06% of servicers’ portfolio volume in the prior month to 1.67% as of November 30, 2021. According to MBA’s estimate, 835,000 homeowners are in forbearance plans.
The share of Fannie Mae and Freddie Mac loans in forbearance decreased 16 basis points to 0.76%. Ginnie Mae loans in forbearance decreased 42 basis points to 2.10%, and the forbearance share for portfolio loans and private-label securities (PLS) declined 106 basis points to 3.94%.
“The share of loans in forbearance in November declined – albeit at a slower pace than October – as borrowers continued to near the expiration of their forbearance plans and moved into permanent loan workout solutions,” said Marina Walsh, CMB, MBA’s Vice President of Industry Analysis.
Total loans serviced that were current (not delinquent or in foreclosure) as a percent of servicing portfolio volume (#) rose to 94.58% in November from 94.32% in October (on a non-seasonally adjusted basis). Total completed loan workouts from 2020 and onward (repayment plans, loan deferrals/partial claims, loan modifications) that were current as a percent of total completed workouts declined to 83.69% last month from 84.04% in October.
emphasis added
 Click on graph for larger image.
This graph shows the percent of portfolio in forbearance by investor type over time. The number of forbearance plans is decreasing rapidly recently since many homeowners have reached the end of the 18-month term.
Review: Ten Economic Questions for 2021
by Calculated Risk on 12/20/2021 02:21:00 PM
At the end of last year, I posted Ten Economic Questions for 2021. I followed up with a brief post on each question. Here is review (we don't have all data yet, but enough). I've linked to my posts from the beginning of the year, with a brief excerpt and a few comments.
Note: Every year, I've posted a disclaimer that a recession could be caused by "An exogenous event such as a pandemic, significant military conflict, disruption of energy supplies for any reason, a major natural disaster (meteor strike, super volcano, etc), and a number of other low probability reasons" (emphasis added).
Unfortunately, 2020 saw one of those "low probability" events, and many of my predictions weren't even close. And I was wrong again on several questions in 2021 (I assumed "by mid-year people will engage in normal economic activity"). In a way, this is the point of the predictions. I don't have a crystal ball, but I think it helps to outline what I think will happen - and understand - and change my mind, when the outlook is wrong. As an example, when the pandemic hit, I switched from being mostly positive on the economy to calling a recession in early March 2020.
10) Question #10 for 2021: How much damage did the pandemic do to certain sectors?
"However, my sense is people will return to travel and entertainment activities once the pandemic ends (maybe less business travel - that would be a negative for airlines and hotels). The return might be slow at first, but people will gradually gain confidence.This has generally been correct, as the Seven High Frequency Indicators for the Economy shows. Also, certain areas of commercial real estate struggled in 2021, and business travel has been slow to return (compared to leisure travel).
So, once the pandemic subsides, my guess is certain sectors of CRE will still struggle, and possibly sectors related to business travel will be negatively impacted. "
This might be one of the most important housing questions for 2021!According to the October NAR report on existing home sales, inventory was down 12% year-over-year in November, and the months-of-supply was at 2.4 months. In 2020, inventory really declined due to a combination of potential sellers keeping their properties off the market during a pandemic, and a pickup in buying due to record low mortgage rates, a move away from multi-family rentals and strong second home buying (to escape the high-density cities). Inventory will be down again in 2021 and will probably set new record lows this Winter.
...
The bottom line is inventory will probably increase, especially in the 2nd half of 2021 (with the assumption that the pandemic will be mostly over by mid-year) - maybe back up to the 2017 - 2019 levels.
8) Question #8 for 2021: What will happen with house prices in 2021?
"My guess (based on my inventory forecast and a recovering economy) is that year-over-year price increases will probably be the strongest early in the year, and then soften somewhat towards the end of 2021. It seems likely that price appreciation will decrease from the 2020 pace, but still be in the mid-single digit range in 2021."This was way off. The CoreLogic data for October showed prices up 18.0% year-over-year. The September Case-Shiller data showed prices up 19.5% YoY. With inventory lower than expected, house prices picked up much more than expected.
7) Question #7 for 2021: How much will RI increase in 2021? How about housing starts and new home sales in 2021?
"My guess is starts will be up year-over-year in 2021 by high single digits. However, my guess is new home sales will soften in the second half of 2021 (based on my expectation of more existing home inventory), and will be up mid single digits (a decline from the sales rate over the last 5 months). It is even possible that sales will be flat to slightly down in 2021, but that will depend on inventory and the course of the pandemic."Through November, starts were up 16.3% year-over-year compared to the same period in 2019. New home sales were down 4.4% year--to-date through October. Starts were stronger than expected, but new home sales were down.
6) Question #6 for 2021: Will the Fed raise rates in 2021? What about the asset purchase program?
"There will be no rate hike in 2021, and since I'm assuming the pandemic will subside by mid-year 2021, it seems likely the Fed will taper asset purchases sometime in the second half of 2021."This was correct.
5) Question #5 for 2021: Will the core inflation rate increase in 2021? Will too much inflation be a concern in 2021?
"My guess is core PCE inflation (year-over-year) will increase in 2021 (from the current 1.4%), but I think too much inflation will NOT be a concern in 2021."According to the October Personal Income and Outlays report, the October PCE price index increased 4.1 percent year-over-year and the October PCE price index, excluding food and energy, increased 5.0 percent year-over-year. Inflation was higher than expected and is now a concern for many.
4) Question #4 for 2021: Will the overall participation rate increase to pre-pandemic levels (63.4% in February 2020) , or will it will only partially recover in 2021?
"My guess, based on the pandemic ending around mid-year, is that most of these people will return to the labor force. I don't expect that participation rate to increase to pre-pandemic levels (63.4%), but it seems reason[able that] the participation rate will increase to the mid-to-high 62s by year end."The Labor Force Participation Rate was at 61.8% in November. This remained lower than expected as many people didn't return to the labor force.
3) Question #3 for 2021: What will the unemployment rate be in December 2021?
"Depending on the estimate for the participation rate and job growth (next question), my guess is the unemployment rate will decline into the mid 5% range by December 2021 from the current 6.7%. Hopefully I'm too pessimistic."I was too pessimistic. The unemployment rates was at 4.2% in November, partially because participation remained lower than I expected.
2) Question #2 for 2021: Will all the jobs lost in 2020 return in 2021, or will job growth be sluggish?
"With 3.7 million permanent job losers - about 2.5 million more than at the beginning of 2020 - it seems unlikely the economy will add back the remaining 9 million jobs lost within a year, and also add jobs for new entrants in 2021. I think something like 6 to 8 million jobs could be added in 2021, but it will depend on ending the pandemic and appropriate fiscal policy. "As of the November employed report, the year-over-year change was +5.8 million jobs.. This was close to my guess.
1) Question #1 for 2021: How much will the economy grow in 2021?
"My guess is there are certain sectors that will be slow to recover, and some - like some sectors of commercial real estate - that will barely contribute to growth in 2021. These factors suggest real GDP growth probably in the 4.5% to 5.5% range in 2021, with some upside potential."It appears GDP growth will be close to 5.5% in 2021.
This was another difficult year. My biggest misses were on inflation, housing inventory, house prices and the unemployment rate. I was correct on the Fed, GDP growth, and close on new home sales and job growth.
Housing Inventory December 20th Update: Inventory Down 3.9% Week-over-week
by Calculated Risk on 12/20/2021 10:07:00 AM
Tracking existing home inventory is very important this year and in 2022.
Inventory usually declines sharply over the holidays - so we will likely see new record lows in the next few weeks.
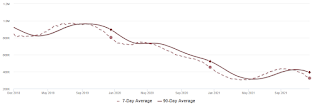
This inventory graph is courtesy of Altos Research.
As of December 17th, inventory was at 326 thousand (7-day average), compared to 454 thousand for the same week a year ago. That is a decline of 28.2%. Inventory is down 3.9% from last week.
Compared to the same week in 2019, inventory is down 59.5% from 804 thousand. A week ago, inventory was at 339 thousand, and was down 27.7% YoY.
Seasonally, inventory bottomed in April (usually inventory bottoms in January or February). Inventory last week was about 6.3% above the record low set-in early April.
Inventory peaked for the year in early September, when inventory was at 437 thousand (the peak for the year), so inventory is currently off about 25.5% from the peak for the year.
Mike Simonsen discusses this data regularly on Youtube.
Seven High Frequency Indicators for the Economy
by Calculated Risk on 12/20/2021 08:32:00 AM
These indicators are mostly for travel and entertainment. It is interesting to watch these sectors recover as the pandemic subsides.
The TSA is providing daily travel numbers.
This data is as of December 19th.
 Click on graph for larger image.
This data shows the 7-day average of daily total traveler throughput from the TSA for 2019 (Light Blue), 2020 (Blue) and 2021 (Red).
The dashed line is the percent of 2019 for the seven-day average.
The 7-day average is down 17.7% from the same day in 2019 (82.3% of 2019). (Dashed line)
Air travel had been off about 20% relative to 2019 for the last four months (with some ups and downs) - but picked up over the Thanksgiving holiday week.
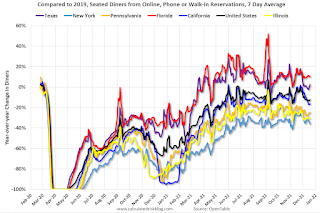
The second graph shows the 7-day average of the year-over-year change in diners as tabulated by OpenTable for the US and several selected cities.
IMPORTANT: OpenTable notes: "we’ve updated the data including downloadable dataset from January 1, 2021 onward to compare seated diners from 2021 to 2019, as opposed to year over year." Thanks!
 Thanks to OpenTable for providing this restaurant data:
This data is updated through December 18, 2021.
This data is "a sample of restaurants on the OpenTable network across all channels: online reservations, phone reservations, and walk-ins. For year-over-year comparisons by day, we compare to the same day of the week from the same week in the previous year."
Note that this data is for "only the restaurants that have chosen to reopen in a given market". Since some restaurants have not reopened, the actual year-over-year decline is worse than shown.
Dining is mostly moving sideways, and there has been no significant decline - yet - due to the winter wave of COVID. The 7-day average for the US is down 12% compared to 2019.
Thanks to OpenTable for providing this restaurant data:This data is updated through December 18, 2021.
This data is "a sample of restaurants on the OpenTable network across all channels: online reservations, phone reservations, and walk-ins. For year-over-year comparisons by day, we compare to the same day of the week from the same week in the previous year."
Note that this data is for "only the restaurants that have chosen to reopen in a given market". Since some restaurants have not reopened, the actual year-over-year decline is worse than shown.
Dining is mostly moving sideways, and there has been no significant decline - yet - due to the winter wave of COVID. The 7-day average for the US is down 12% compared to 2019.
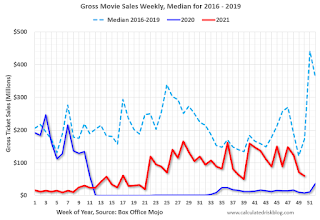 This data shows domestic box office for each week and the median for the years 2016 through 2019 (dashed light blue).
 Blue is 2020 and Red is 2021.
The data is from BoxOfficeMojo through December 16th.
Note that the data is usually noisy week-to-week and depends on when blockbusters are released.
Movie ticket sales were at $59 million last week, down about 66% from the median for the week.
Note that the data is usually noisy week-to-week and depends on when blockbusters are released.
Movie ticket sales were at $59 million last week, down about 66% from the median for the week.
The numbers next week will include the newest Spider Man.
 This graph shows the seasonal pattern for the hotel occupancy rate using the four week average.
 The red line is for 2021, black is 2020, blue is the median, dashed purple is 2019, and dashed light blue is for 2009 (the worst year on record for hotels prior to 2020).
This data is through December 11th. The occupancy rate was down 4.8% compared to the same week in 2019. Although down compared to 2019, the 4-week average of the occupancy rate is now above the median rate for the previous 20 years (Blue).
Notes: Y-axis doesn't start at zero to better show the seasonal change.
The 4-week average occupancy rate will now decline seasonally into the new year.
 This graph, based on weekly data from the U.S. Energy Information Administration (EIA), shows gasoline supplied compared to the same week of 2019.
Blue is for 2020. Red is for 2021.
As of December 10th, gasoline supplied was up 0.6% compared to the same week in 2019.
This was the 12th week this year that gasoline supplied was up compared to the same week in 2019 - so consumption is running close to 2019 levels now.
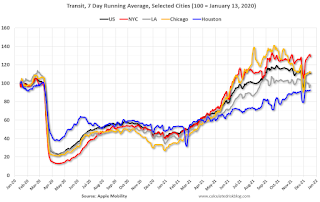
This graph is from Apple mobility. From Apple: "This data is generated by counting the number of requests made to Apple Maps for directions in select countries/regions, sub-regions, and cities." This is just a general guide - people that regularly commute probably don't ask for directions.
There is also some great data on mobility from the Dallas Fed Mobility and Engagement Index. However the index is set "relative to its weekday-specific average over January–February", and is not seasonally adjusted, so we can't tell if an increase in mobility is due to recovery or just the normal increase in the Spring and Summer.
 This data is through December 17th
 for the United States and several selected cities.
The graph is the running 7-day average to remove the impact of weekends.
IMPORTANT: All data is relative to January 13, 2020. This data is NOT Seasonally Adjusted. People walk and drive more when the weather is nice, so I'm just using the transit data.
According to the Apple data directions requests, public transit in the 7-day average for the US is at 111% of the January 2020 level.
New York City is doing well by this metric, but subway usage in NYC is down significantly (next graph).
----- New York City Subway Usage -----
Here is some interesting data on New York subway usage (HT BR).
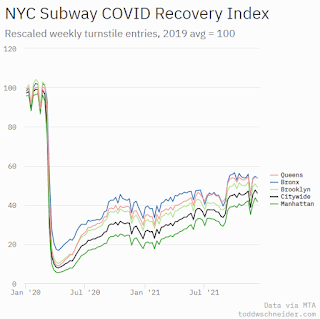 This graph is from Todd W Schneider.
Here is some interesting data on New York subway usage (HT BR).
This graph is from Todd W Schneider. This graph shows how much MTA traffic has recovered in each borough (Graph starts at first week in January 2020 and 100 = 2019 average).
Manhattan is at about 42% of normal.
This data is through Friday, December 17th.
He notes: "Data updates weekly from the MTA’s public turnstile data, usually on Saturday mornings".
Sunday, December 19, 2021
Sunday Night Futures
by Calculated Risk on 12/19/2021 06:48:00 PM
Weekend:
• Schedule for Week of December 19, 2021
Monday:
• No major economic releases scheduled.
From CNBC: Pre-Market Data and Bloomberg futures S&P 500 futures are down 12 and DOW futures are down 134 (fair value).
Oil prices were down over the last week with WTI futures at $69.18 per barrel and Brent at $72.07 per barrel. A year ago, WTI was at $49, and Brent was at $52 - so WTI oil prices are up 40% year-over-year.
Here is a graph from Gasbuddy.com for nationwide gasoline prices. Nationally prices are at $3.29 per gallon. A year ago prices were at $2.21 per gallon, so gasoline prices are up $1.08 per gallon year-over-year.
Saturday, December 18, 2021
Real Estate Newsletter Articles this Week
by Calculated Risk on 12/18/2021 02:11:00 PM
At the Calculated Risk Real Estate Newsletter this week:
• 4th Look at Local Housing Markets in November This update adds Austin, California, Des Moines, Memphis, Minneapolis, Minnesota, Rhode Island, and Sacramento.
• November Housing Starts: Most Housing Units Under Construction Since 1973 Housing Starts Increased to 1.679 million Annual Rate in November
• The Household Mystery Looking back at People per Household in the '70s
• 3rd Look at Local Housing Markets in November Looks like we will see new record low inventories this winter
This is usually published several times a week, and provides more in-depth analysis of the housing market.
The blog will continue as always!
You can subscribe at https://calculatedrisk.substack.com/ Currently all content is available for free - and some will always be free - but please subscribe!.
You can subscribe at https://calculatedrisk.substack.com/ Currently all content is available for free - and some will always be free - but please subscribe!.
Schedule for Week of December 19, 2021
by Calculated Risk on 12/18/2021 08:11:00 AM
Happy Holidays and Merry Christmas!
The key economic reports this week are New Home Sales, Existing Home Sales, the 3rd estimate of Q3 GDP, and November Personal income and outlays.
No major economic releases scheduled.
No major economic releases scheduled.
7:00 AM ET: The Mortgage Bankers Association (MBA) will release the results for the mortgage purchase applications index.
8:30 AM: Gross Domestic Product, 3rd quarter 2021 (Third estimate). The second estimate of GDP was 2.1%.
8:30 AM: Chicago Fed National Activity Index for November. This is a composite index of other data.
 10:00 AM: Existing Home Sales for November from the National Association of Realtors (NAR). The consensus is for 6.20 million SAAR, down from 6.34 million.
The graph shows existing home sales from 1994 through the report last month.
Housing economist Tom Lawler expects the NAR to report sales of 6.45 million SAAR for November.
8:30 AM: The initial weekly unemployment claims report will be released. Initial claims were 206 thousand last week.
8:30 AM: Durable Goods Orders for November.
8:30 AM: Personal Income and Outlays for November. The consensus is for a 0.2% increase in personal income, and for a 1.0% increase in personal spending.
 10:00 AM: New Home Sales for November from the Census Bureau.
 This graph shows New Home Sales since 1963. The dashed line is the sales rate for last month.
New home sales were at 745 thousand in October.
10:00 AM: University of Michigan's Consumer sentiment index (Final for December).
All US markets will be closed in observance of the Christmas Holiday.


