 RSS Feed
 by Calculated Risk on 6/22/2010 10:00:00 AM
Showing posts with label Existing Home Sales. Show all posts
Showing posts with label Existing Home Sales. Show all posts
Tuesday, June 22, 2010
Existing Home Sales decline in May
The NAR reports: May Shows a Continued Strong Pace for Existing-Home Sales
Existing-home sales, which are completed transactions that include single-family, townhomes, condominiums and co-ops, were at a seasonally adjusted annual rate of 5.66 million units in May, down 2.2 percent from an upwardly revised surge of 5.79 million units in April. May closings are 19.2 percent above the 4.75 million-unit level in May 2009; April sales were revised to show an 8.0 percent monthly gain.
...
Total housing inventory at the end of May fell 3.4 percent to 3.89 million existing homes available for sale, which represents an 8.3-month supply at the current sales pace, compared with an 8.4-month supply in April. Raw unsold inventory is 1.1 percent above a year ago, but is still 14.9 percent below the record of 4.58 million in July 2008.
 Click on graph for larger image in new window.
This graph shows existing home sales, on a Seasonally Adjusted Annual Rate (SAAR) basis since 1993.
Sales in May 2010 (5.66 million SAAR) were 2.2% lower than last month, and were 19.2% higher than May 2009 (4.75 million SAAR).
 The second graph shows nationwide inventory for existing homes.
According to the NAR, inventory decreased to 3.89 million in May from 4.04 million in April. The all time record high was 4.58 million homes for sale in July 2008.
Inventory is not seasonally adjusted and there is a clear seasonal pattern with inventory increasing in the spring and into the summer. The increase in April 2010 was partially related to sellers hoping to take advantage of the housing tax credit, and a decline in May was expected (I'll have more on inventory later).
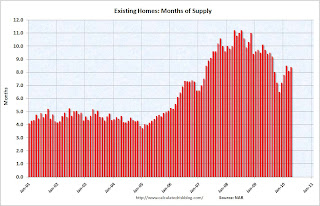
 The last graph shows the 'months of supply' metric.
Months of supply decreased slightly to 8.3 months in May. A normal market has under 6 months of supply, so this is high - and probably excludes some substantial shadow inventory. And the months of supply will probably increase sharply this summer as sales fade.
This was a very weak report - as anticpated by Tom Lawler yesterday (see Lawler: Home Sales in May: A Look at the Data ). I'll have more ...
Tuesday, June 15, 2010
SoCal Home sales at 4 Year High
by Calculated Risk on 6/15/2010 05:55:00 PM
From DataQuick: Southland sales at 4-year high
Note: as always I ignore the median price and use the repeat sales indexes from Case-Shiller and CoreLogic.
Southern California home sales rose last month in all but the lowest price categories as buyers took advantage of tax credits and low mortgage rates. ... A total of 22,270 new and resale houses and condos closed escrow in Los Angeles, Riverside, San Diego, Ventura, San Bernardino and Orange counties last month. That was up 9.7 percent from 20,299 in April, and up 7.2 percent from 20,775 in May 2009, according to MDA DataQuick of San Diego.And here is the dumb headline of the day: Southern California median home price surges 22.5% (ht JBR). So what? That just says the mix changed ... and that is because the distressed sales are moving on up to higher priced neighborhood.
May sales were the highest for that month since May 2006, but they still fell 15.0 percent short of the average number sold in May since 1988, when DataQuick’s statistics begin. The 9.7 percent increase in sales between April and May compares with an average change of 6 percent since 1988.
...
“The important thing to remember, though, is that what we saw in May was partly driven by government stimulus,” he continued. “In the second half of the year the market will have to stand on its own again, barring new forms of government involvement. Prices will be tested if there’s any sudden move by lenders to release a flood of distressed properties.”
Foreclosure resales accounted for 33.9 percent of the resale market last month, down from 36.4 percent in April and 49.8 percent a year earlier. The all-time high for foreclosure resales – homes that had been foreclosed on in the prior 12 months – was 56.7 percent in February 2009. Foreclosure resales have waned over the last year as lenders have channeled more distress into loan modifications and short sales.
...
Foreclosure activity remains high by historical standards but is lower than peak levels reached over the last two years.
What matter is this is probably the high point for sales this year. This report includes both new and existing home sales, and new home sales are counted when the contract is signed (peaked in April) and existing home sales are counted when the transaction closes (will peak in May or June).
Wednesday, June 02, 2010
Pending Home Sales "Surge" in April
by Calculated Risk on 6/02/2010 10:00:00 AM
From the NAR: Pending Home Sales Surge Continuing
The Pending Home Sales Index, a forward-looking indicator, rose 6.0 percent to 110.9 based on contracts signed in April, from an upwardly revised 104.6 in March, and is 22.4 percent higher than April 2009 when it was 90.6. That follows gains of 7.1 percent in March and 8.3 percent in February.Once again this is no surprise - the tax credit has pulled demand forward, and existing home sales will decline after June (existing home sales are counted when the contract closes).
Pending home sales are at the highest level since last October when the index reached 112.4 and first-time buyers were rushing to beat the initial deadline for the tax credit. The data reflects contracts and not closings, which usually occur with a lag time of one or two months.
I suspect a number of these homes will never close. I've heard stories of buyers entering into two deals at the end of April, intending to cancel one. Also some short sales will probably not close on time because of the lengthy process.
Post title next month: Pending home sales collapse in May!
Monday, May 24, 2010
Existing Home Sales: Inventory increases Year-over-Year
by Calculated Risk on 5/24/2010 11:25:00 AM
Earlier the NAR released the existing home sales data for April; here are a couple more graphs ...
The first graph shows the year-over-year (YoY) change in reported existing home inventory and months-of-supply. Inventory is not seasonally adjusted, so it really helps to look at the YoY change.  Click on graph for larger image in new window.
Inventory increased 2.7% YoY in April, the first YoY increase since 2008.
This increase in the inventory is especially concerning because the reported inventory is already historically very high, and the 8.4 months of supply in April is well above normal. The months of supply will probably decline over the next two months because of the increase in sales due to the tax credit (reported at closing), but this will be something to watch this summer and later this year.
Perhaps this was an especially large surge in inventory as sellers tried to take advantage of the tax credit, but it is also possible that we will see close to double digit months of supply later this year.  The second graph shows NSA monthly existing home sales for 2005 through 2010 (see Red columns for 2010).
Sales (NSA) in April 2010 were 26% higher than in April 2009, and also higher than in April of 2007 and 2008.
We will probably see an increase in sales in May and June - perhaps to the levels of 2006 or 2007 - because of the tax credit, however I expect to see existing home sales below last year in the 2nd half of this year.
I think this was a weak report. Sales were up because of the tax credit (pulling sales forward), but that does very little for the economy. The key is the increase in the inventory and months-of-supply, and if these two measures increase later this year (after the distortions in May and June), then there will be additional downward pressure on house prices.
Existing Home Sales increase in April
by Calculated Risk on 5/24/2010 10:00:00 AM
The NAR reports: Existing-Home Sales Rise
Existing-home sales, which are completed transactions that include single-family, townhomes, condominiums and co-ops, increased 7.6 percent to a seasonally adjusted annual rate of 5.77 million units in April from an upwardly revised 5.36 million in March, and are 22.8 percent higher than the 4.70 million-unit pace in April 2009.
...
Total housing inventory at the end of April rose 11.5 percent to 4.04 million existing homes available for sale, which represents an 8.4-month supply at the current sales pace, up from an 8.1-month supply in March.
 Click on graph for larger image in new window.
This graph shows existing home sales, on a Seasonally Adjusted Annual Rate (SAAR) basis since 1993.
Sales in April 2010 (5.77 million SAAR) were 7% higher than last month, and were 22.8% higher than April 2009 (4.61 million SAAR).
Sales surged last November when many first-time homebuyers rushed to beat the initial expiration of the tax credit. There will probably be a further increase in May and June this year. Note: existing home sales are counted at closing, so even though contracts must be signed in April to qualify for the tax credit, buyers have until June 30th to close.
 The second graph shows nationwide inventory for existing homes.
According to the NAR, inventory increased to 4.04 million in April from 3.63 million in March. The all time record high was 4.57 million homes for sale in July 2008.
Inventory is not seasonally adjusted and there is a clear seasonal pattern - inventory should increase further in the spring. This is an increase from April 2009, and this breaks a streak of 20 consecutive months of year-over-year declines in inventory (I'll have more on inventory).
 The last graph shows the 'months of supply' metric.
Months of supply increased to 8.4 months in April. A normal market has under 6 months of supply, so this is high - and probably excludes some substantial shadow inventory. And the months of supply will probably increase sharply this summer.
I'll have more later ... the increase in inventory is the big story.
Tuesday, May 04, 2010
Pending Home Sales increase in March
by Calculated Risk on 5/04/2010 10:00:00 AM
From the NAR: Pending Home Sales on an Upswing
The Pending Home Sales Index, a forward-looking indicator based on contracts signed in March, rose 5.3 percent to 102.9 from 97.7 in February, and is 21.1 percent above March 2009 when it was 85.0; this follows an 8.3 percent increase in February. The data reflects contracts and not closings, which usually occur with a lag time of one or two months.This is no surprise - the tax credit has pulled demand forward, and existing home sales will decline after June (existing home sales are counted when the contract closes).
...
"In the months immediately following the expiration of the tax credit, we expect measurably lower sales,” [Lawrence Yun, NAR chief economist] said.
Friday, April 23, 2010
Home Sales: Distressing Gap
by Calculated Risk on 4/23/2010 01:00:00 PM
First a comment on the seasonal adjustment ... on a Not Seasonally Adjusted (NSA) basis, the Census Bureau reported there were 38,000 new homes sold in March. That is up from 31,000 in March 2009.
Some (or all) of the increase was due to a one time event - the tax credit that expires in April. The Census Bureau doesn't know the number of homes sold due to the tax credit, so they report the Seasonally Adjusted Annual Rate (SAAR) assuming this is the underlying rate of sales. It isn't.
The April new home sales headline number will be distorted too, but the key is the actual underlying sales rate is much lower.
Note: remember the tax credit shows up in the new home sales numbers when the contract is signed (March and April), and in the existing home sales numbers when the transactions are closed (April through June).
The following graph shows existing home sales (left axis) and new home sales (right axis) through March. Click on graph for larger image in new window.
The initial gap was caused by the flood of distressed sales. This kept existing home sales elevated, and depressed new home sales since builders couldn't compete with the low prices of all the foreclosed properties.
The spike in existing home sales last year was due primarily to the first time homebuyer tax credit. Notice that there was also a bump last year in new home sales from the tax credit.
We are seeing another bump this year with the expiration of the extension of the tax credit.
The second graph shows the same information as a ratio - new home sales divided by existing home sales - through March 2010. The ratio increased because the tax credit impacts new home sales first. I suspect this ratio will be at or near the all time low later this year.
Eventually this ratio will return to the historical range of new home sales being around 15% to 20% of existing home sales. However it will probably take a number of years to return to a more normal market.
Thursday, April 22, 2010
More on Existing Home Sales and Inventory
by Calculated Risk on 4/22/2010 11:19:00 AM
Earlier the NAR released the existing home sales data for March; here are a couple more graphs ...
The first graph shows the year-over-year change in reported existing home inventory and months-of-supply. Click on graph for larger image in new window.
There was a rapid increase in inventory in the 2nd half of 2005 (that helped me call the peak of the bubble). Then the increase in inventory steadily slowed.
The YoY inventory has been decreasing for the last 20 months. However the YoY decline is getting smaller - only 1.8% in March.
This slow decline in the inventory is especially concerning with the large reported inventory and 8.0 months of supply in March - well above normal. Of course months of supply will decline over the next few months because of the increase in sales due to the tax credit, but this will be something to watch this summer and later this year. The second graph shows NSA monthly existing home sales for 2005 through 2010 (see Red columns for 2010).
Sales (NSA) in March 2010 were 19.6% higher than in March 2009, and also higher than in March 2008.
We will probably see an increase in sales in May and June - perhaps to the levels of 2006 or 2007 - because of the tax credit, however I expect to see existing home sales below last year in the 2nd half of this year.
Existing Home Sales increase in March
by Calculated Risk on 4/22/2010 10:00:00 AM
The NAR reports: Existing-Home Sales Rise
Existing-home sales, which are completed transactions that include single-family, townhomes, condominiums and co-ops, rose 6.8 percent to a seasonally adjusted annual rate of 5.35 million units in March from 5.01 million in February, and are 16.1 percent above the 4.61 million-unit level in March 2009.
...
Total housing inventory at the end of March rose 1.5 percent to 3.58 million existing homes available for sale, which represents an 8.0-month supply at the current sales pace, down from an 8.5-month supply in February.
 Click on graph for larger image in new window.
This graph shows existing home sales, on a Seasonally Adjusted Annual Rate (SAAR) basis since 1993.
Sales in March 2010 (5.35 million SAAR) were 6.8% higher than last month, and were 16.1% higher than March 2009 (4.61 million SAAR).
Sales surged last November when many first-time homebuyers rushed to beat the initial expiration of the tax credit. There will probably be another increase in May and June this year, although that will be probably be smaller than the November increase. Note: existing home sales are counted at closing, so even though contracts must be signed in April to qualify for the tax credit, buyers have until June 30th to close.
 The second graph shows nationwide inventory for existing homes.
According to the NAR, inventory increased to 3.58 million in March from 3.53 million in February. The all time record high was 4.57 million homes for sale in July 2008.
Inventory is not seasonally adjusted and there is a clear seasonal pattern - inventory should increase further in the spring. This was the 20th consecutive month of reported year-over-year decline in inventory, but the decline was only 1.8% from March 2009.
 The last graph shows the 'months of supply' metric.
Months of supply decreased to 8.0 months in March.
A normal market has under 6 months of supply, so this is high - and probably excludes some substantial shadow inventory.
I'll have more later ...
Tuesday, March 23, 2010
More on Existing Home Sales and Inventory
by Calculated Risk on 3/23/2010 11:22:00 AM
Earlier the NAR released the existing home sales data for February; here are a couple more graphs ...  Click on graph for larger image in new window.
This graph shows NSA monthly existing home sales for 2005 through 2010 (see Red columns for 2010).
Sales (NSA) in February 2010 were 7.9% higher than in February 2009, and 3.2% lower than in February 2008.
We will probably see an increase in sales in May and June because of the tax credit, however I expect to see existing home sales below last year later this year.
The second graph shows the Year-over-year change in reported existing home inventory. There was a rapid increase in inventory in the 2nd half of 2005 (that helped me call the peak of the bubble), and the YoY inventory has been decreasing for the last 19 months. However the YoY decline is getting smaller - even with a large reported inventory (and probably more shadow inventory). This is something to watch.
This slow decline in the inventory is especially concerning with 8.6 months of supply in February - well above normal.
Existing Home Sales Decline in February
by Calculated Risk on 3/23/2010 10:00:00 AM
The NAR reports: February Existing-Home Sales Ease with Mixed Conditions Around the Country
Existing-home, which are finalized transactions that include single-family, townhomes, condominiums and co-ops, slipped 0.6 percent nationally to a seasonally adjusted annual rate of 5.02 million units in February from 5.05 million in January, but are 7.0 percent higher than the 4.69 million-unit pace in February 2009.
...
Total housing inventory at the end of February rose 9.5 percent to 3.59 million existing homes available for sale, which represents an 8.6-month supply at the current sales pace, up from a 7.8-month supply in January. Raw unsold inventory is 5.5 percent below a year ago.
 Click on graph for larger image in new window.
This graph shows existing home sales, on a Seasonally Adjusted Annual Rate (SAAR) basis since 1993.
Sales in February 2010 (5.02 million SAAR) were 0.6% lower than last month, and were 7.0% higher than February 2009 (4.69 million SAAR).
Sales surged last November when many first-time homebuyers rushed to beat the initial expiration of the tax credit. There will probably be another increase in May and June this year, although that will be probably be smaller than the November increase. Note: existing home sales are counted at closing, so even though contracts must be signed in April to qualify for the tax credit, buyers have until June 30th to close.
 The second graph shows nationwide inventory for existing homes.
According to the NAR, inventory increased to 3.59 million in February from 3.27 million in January. The all time record high was 4.57 million homes for sale in July 2008.
Inventory is not seasonally adjusted and there is a clear seasonal pattern - inventory should increase further in the spring.
 The last graph shows the 'months of supply' metric.
Months of supply increased to 8.6 months in February.
A normal market has under 6 months of supply, so this is high - and probably excludes some substantial shadow inventory.
I'll have more later ...
Friday, February 26, 2010
Tax Credits: Vehicle and Existing Home Sales
by Calculated Risk on 2/26/2010 01:29:00 PM
By request, here is a graph overlaying light vehicle sales and existing home sales - and showing the impact of "cash for clunkers" and the "first time home buyer" tax credit. (ht Brian) Click on graph for larger image in new window.
The red line (left axis) is vehicle sales. The blue line (right axis) is existing home sales since Jan 2008. Both are in millions of units at a Seasonally Adjusted Annual Rate (SAAR).
The Cash for Clunkers program was effective on July 1, 2009, but didn't really start until near the end of July. The program was expanded in early August, and ended on August 24th.
The First Time Home Buyer tax credit was passed in February with an initial deadline to close on the home by November 30, 2009. The home buyer tax credit was extended and expanded at the end of October, and now buyers must sign a contract by April 30, 2010, and close by June 30, 2010.
There will probably be another surge in existing home sales in May and June (reported when sales close). And then sales will probably decline again.
More on Existing Home Sales
by Calculated Risk on 2/26/2010 11:07:00 AM
Earlier the NAR released the existing home sales data for January; here are a few more graphs ...  Click on graph for larger image in new window.
This graph shows NSA monthly existing home sales for 2005 through 2010 (see Red column for Jan 2010).
Sales (NSA) in January 2010 were 7% higher than in January 2009, and slightly lower than in January 2008.
The second graph shows existing home sales (left axis) and new home sales (right axis) through January. I jokingly refer to this as the "distressing gap". The initial gap was caused by the flood of distressed sales. This kept existing home sales elevated, and depressed new home sales since builders couldn't compete with the low prices of all the foreclosed properties.
The recent spike in existing home sales was due primarily to the first time homebuyer tax credit.
The following graph shows the same information as a ratio - existing home sales divided by new home sales - through January 2010. This ratio is just off from the all time high in November when existing home sales were artificially boosted by the first time home buyer tax credit.
Eventually this ratio will return to the historical range of around 6 existing home sales per new home sale. Right now this graph shows that the housing market is far from normal.
Existing Home Sales Decline Sharply in January
by Calculated Risk on 2/26/2010 10:00:00 AM
The NAR reports: Existing-Home Sales Down in January
Existing-home sales – including single-family, townhomes, condominiums and co-ops – dropped 7.2 percent to a seasonally adjusted annual rate1 of 5.05 million units in January from a revised 5.44 million in December, but remain 11.5 percent above the 4.53 million-unit level in January 2009.
Total housing inventory at the end of January fell 0.5 percent to 3.27 million existing homes available for sale, which represents a 7.8-month supply at the current sales pace, up from a 7.2-month supply in December.
 Click on graph for larger image in new window.
This graph shows existing home sales, on a Seasonally Adjusted Annual Rate (SAAR) basis since 1993.
Sales in Jan 2010 (5.05 million SAAR) were 7.2% lower than last month, and were 11.5% higher than Jan 2009 (4.53 million SAAR).
This is a sharp drop from November when many of the transactions were due to first-time homebuyers rushing to beat the initial expiration of the tax credit (that has been extended). That pushed sales far above the historical normal level; based on normal turnover, existing home sales would be in the 4.5 to 5.0 million SAAR range.
 The second graph shows nationwide inventory for existing homes. According to the NAR, inventory decreased to 3.27 million in January from 3.29 million in December. The all time record high was 4.57 million homes for sale in July 2008.
 This is not seasonally adjusted and this decline is mostly seasonal - inventory should increase in the Spring.
 The third graph shows the 'months of supply' metric.
Months of supply increased to 7.8 months in January.
A normal market has under 6 months of supply, so this is high - and probably excludes some substantial shadow inventory.
I'll have more later ...
Monday, January 25, 2010
More on Existing Home Sales
by Calculated Risk on 1/25/2010 12:14:00 PM
Earlier the NAR released the existing home sales data for December; here are a few more graphs ...  Click on graph for larger image in new window.
This graph shows NSA monthly existing home sales for 2005 through 2009 (see Red columns for 2009).
Sales (NSA) in December were much higher than in December 2007 and 2008.
The second graph shows existing home sales (left axis) through December, and new home sales (right axis) through November. The initial gap was caused by the flood of distressed sales. This kept existing home sales elevated, and depressed new home sales since builders couldn't compete with the low prices of all the foreclosed properties.
The recent spike in existing home sales was due primarily to the first time homebuyer tax credit.
Eventually - when the housing market is more healthy - the ratio of existing to new home sales will probably return to the historical relationship. The third graph shows existing home sales and year end inventory as a percent of total owner occupied homes.
Both sales and inventory are above the normal range, although reported inventory has been declining for two years.
Both sales and inventory are being heavily impacted by government policies (boosting sales through tax credits and low mortgage rates, and limiting inventory through modification programs). There is probably a substantial "shadow inventory" that will come on the market, but the timing and size of the inventory are unknown.
The term "shadow inventory" is used in different ways. I consider all of the following to be "shadow inventory":
Probably the most important point to remember is that what matters for the economy and jobs is new home sales and residential investment. Until the excess housing inventory is reduced (both home and the rental units), new residential investment will be under pressure.REOs. There are bank owned properties that have not been put on the market yet. Foreclosures in process and seriously delinquent loans (although some of these may be in the modification process). New high rise condos. These properties are not included in the new home inventory report from the Census Bureau, and do not show up anywhere unless they are listed. Homeowners waiting for a better market. These are homeowners waiting for better market conditions to sell.
Existing Home Sales decline Sharply in December
by Calculated Risk on 1/25/2010 10:00:00 AM
The NAR reports: December Existing-Home Sales Down but Prices Rise; 2009 Sales Up
Existing-home sales – including single-family, townhomes, condominiums and co-ops – fell 16.7 percent to a seasonally adjusted annual rate of 5.45 million units in December from 6.54 million in November, but remain 15.0 percent above the 4.74 million-unit level in December 2008.
For all of 2009 there were 5,156,000 existing-home sales, which was 4.9 percent higher than the 4,913,000 transactions recorded in 2008; it was the first annual sales gain since 2005.
...
Total housing inventory at the end of December fell 6.6 percent to 3.29 million existing homes available for sale, which represents a 7.2-month supply at the current sales pace, up from a 6.5-month supply in November.
 Click on graph for larger image in new window.
This graph shows existing home sales, on a Seasonally Adjusted Annual Rate (SAAR) basis since 1993.
Sales in Dec 2009 (5.45 million SAAR) were 16.7% lower than last month, and were 15% higher than Dec 2008 (4.74 million SAAR).
Of course many of the transactions in November were due to first-time homebuyers rushing to beat the initial expiration of the tax credit (that has now been extended). That pushed sales far above the historical normal level; based on normal turnover, existing home sales would be in the 4.5 to 5.0 million SAAR range.
 The second graph shows nationwide inventory for existing homes. According to the NAR, inventory decreased to 3.29 million in December from 3.52 million in November. The all time record high was 4.57 million homes for sale in July 2008.
 This is not seasonally adjusted and December is usually the lowest month of the year - so this decline is mostly seasonal.
 The third graph shows the 'months of supply' metric for the last six years.
Months of supply increased to 7.2 months in December.
A normal market has under 6 months of supply, so this is still high.
This decline was expected. I'll have more later ... but remember to ignore the median prices (that is distorted by the mix), and to focus more on new home sales than existing home sales.
Tuesday, December 22, 2009
More on Existing Home Sales
by Calculated Risk on 12/22/2009 10:54:00 AM
Earlier the NAR released the existing home sales data for November; here are a couple more graphs ... and a few comments. Click on graph for larger image in new window.
This graph shows NSA monthly existing home sales for 2005 through 2009 (see Red columns for 2009).
Sales (NSA) in November were much higher than in November 2007 and 2008, and were at the same level as November 2006.
Of course - as I noted earlier - many of these transactions in November were due to first-time homebuyers rushing to beat the expiration of the tax credit (that has now been extended).
Note: Existing home sales play an important role in the economy because they allow people to move for new job opportunies, or to move to larger or smaller homes for various reasons. It is the reason that people move that contributes to the economy; churning homes does nothing except generate some fees and commissions. Nothing has been added to the housing stock or the wealth of the nation.
The way to think of existing home sales is as grease for the economy. Once you have enough - probably around 4.5 to 5.0 million units per year - any extra is just a waste.
What matters for the economy are new home sales, housing starts and residential investment. And there has been little improvement in these key indicators - and there will not be any until the huge overhang of excess inventory is reduced.
This really shows up on the following graph:  This graph shows existing home sales (left axis) through November, and new home sales (right axis) through October.
The initial gap was caused by the flood of distressed sales. This kept existing home sales elevated, and depressed new home sales since builders couldn't compete with the low prices of all the foreclosed properties.
The recent spike in existing home sales was due primarily to the first time homebuyer tax credit.
A few more comments:
Existing Home Sales up Sharply in November
by Calculated Risk on 12/22/2009 10:00:00 AM
The NAR reports: Another Big Gain in Existing-Home Sales as Buyers Respond to Tax Credit
Existing-home sales – including single-family, townhomes, condominiums and co-ops – rose 7.4 percent to a seasonally adjusted annual rate of 6.54 million units in November from 6.09 million in October, and are 44.1 percent higher than the 4.54 million-unit pace in November 2008. Current sales remain at the highest level since February 2007 when they hit 6.55 million.
...
Total housing inventory at the end of November declined 1.3 percent to 3.52 million existing homes available for sale, which represents a 6.5-month supply at the current sales pace, down from an 7.0-month supply in October.
 Click on graph for larger image in new window.
This graph shows existing home sales, on a Seasonally Adjusted Annual Rate (SAAR) basis since 1993.
Sales in Nov 2009 (6.54 million SAAR) were 7.4% higher than last month, and were 44% higher than Nov 2008 (4.54 million SAAR).
Of course many of the transactions in November were due to first-time homebuyers rushing to beat the initial expiration of the tax credit (that has now been extended). This has pushed sales far above the historical normal level; based on normal turnover, existing home sales would be in the 4.5 to 5.0 million SAAR range.
 The second graph shows nationwide inventory for existing homes. According to the NAR, inventory decreased to 3.52 million in November from 3.57 million in October. The all time record was 4.57 million homes for sale in July 2008. This is not seasonally adjusted.
Typically inventory peaks in July or August, so this decline is mostly seasonal.
 The third graph shows the 'months of supply' metric for the last six years.
Months of supply declined to 6.5 months in November.
A normal market has under 6 months of supply, so this is still high - and especially considering sales were artificially boosted by the tax credit. I'll have more soon ...
Monday, November 23, 2009
Existing Home Sales Graphs
by Calculated Risk on 11/23/2009 10:42:00 AM
Here is another way to look at existing homes sales: Monthly, Not Seasonally Adjusted (NSA): This graph shows NSA monthly existing home sales for 2005 through 2009. For the fifth consecutive month, sales were higher in 2009 than in 2008.
And for the second straight month, sales in 2009 were higher than in 2007 (two years ago).
Of course many of these transactions in October were due to first-time homebuyers rushing to beat the expiration of the tax credit (that has now been extended). This has pushed sales far above the historical normal level; based on normal turnover, existing home sales would be in the 4.5 to 5.0 million SAAR range.  The second graph shows nationwide inventory for existing homes. According to the NAR, inventory decreased to 3.57 million in October from the upwardly revised 3.71 million in September. The all time record was 4.57 million homes for sale in July 2008. This is not seasonally adjusted.
Typically inventory peaks in July or August, so some of this decline is seasonal. The third graph shows the 'months of supply' metric for the last six years.
Months of supply declined to 7.0 months in October.
Sales increased sharply, and inventory decreased, so "months of supply" declined. A normal market has under 6 months of supply, so this is still high - and especially considering sales were artificially boosted by the tax credit.
Existing Home Sales increase sharply in October
by Calculated Risk on 11/23/2009 10:00:00 AM
The NAR reports: Existing-Home Sales Record Another Big Gain, Inventories Continue to Shrink
Existing-home sales – including single-family, townhomes, condominiums and co-ops – surged 10.1 percent to a seasonally adjusted annual rate1 of 6.10 million units in October from a downwardly revised pace of 5.54 million in September, and are 23.5 percent above the 4.94 million-unit level in October 2008. Sales activity is at the highest pace since February 2007 when it hit 6.55 million.
...
Total housing inventory at the end of October fell 3.7 percent to 3.57 million existing homes available for sale, which represents a 7.0-month supply2 at the current sales pace, down from an 8.0-month supply in September. Unsold inventory totals are 14.9 percent below a year ago.
 Click on graph for larger image in new window.
This graph shows existing home sales, on a Seasonally Adjusted Annual Rate (SAAR) basis since 1993.
Sales in Oct 2009 (6.10 million SAAR) were 10.1% higher than last month, and were 23% higher than Oct 2008 (4.94 million SAAR).
I'll have more soon ...


