 RSS Feed
 by Calculated Risk on 7/22/2010 10:00:00 AM
Showing posts with label Existing Home Inventory. Show all posts
Showing posts with label Existing Home Inventory. Show all posts
Thursday, July 22, 2010
Existing Home Sales decline in June
The NAR reports: Existing-Home Sales Slow in June but Remain Above Year-Ago Levels
Existing-home sales, which are completed transactions that include single-family, townhomes, condominiums and co-ops, fell 5.1 percent to a seasonally adjusted annual rate of 5.37 million units in June from 5.66 million in May, but are 9.8 percent higher than the 4.89 million-unit pace in June 2009.
...
Total housing inventory at the end of June rose 2.5 percent to 3.99 million existing homes available for sale, which represents an 8.9-month supply at the current sales pace, up from an 8.3-month supply in May.
 Click on graph for larger image in new window.
This graph shows existing home sales, on a Seasonally Adjusted Annual Rate (SAAR) basis since 1993.
Sales in June 2010 (5.37 million SAAR) were 5.1% lower than last month, and were 9.8% higher than June 2009 (4.89 million SAAR).
 The second graph shows nationwide inventory for existing homes.
According to the NAR, inventory increased to 3.99 million in June from 3.89 million in May. The all time record high was 4.58 million homes for sale in July 2008.
Inventory is not seasonally adjusted and there is a clear seasonal pattern with inventory increasing in the spring and into the summer. I'll have more on inventory later ...
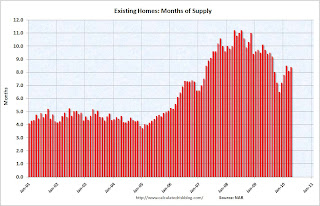
 The last graph shows the 'months of supply' metric.
Months of supply increased to 8.9 months in June from 8.3 months in May. A normal market has under 6 months of supply, so this is already high - and probably excludes some substantial shadow inventory. And the months of supply will increase sharply next month when sales collapse.
I'll have more ...
Wednesday, July 21, 2010
Existing Homes: Months of Supply and House Prices
by Calculated Risk on 7/21/2010 12:08:00 PM
Earlier I mentioned that a normal housing market usually has under 6 months of supply. The NAR reported that months of supply was at 8.3 months in May, and the months of supply was probably be higher in June (to be reported tomorrow).
A quick estimate: If sales are 5.3 million (SAAR) in June, and inventory stays the same at 3.9 million units, the months of supply will rise to 8.8 months in June.
This is calculated as: 3.9 divided by 5.3 * 12 (months) = 8.8 months of supply.
For July, if sales fall to 4.5 million (it could be lower) and inventory is still at 3.9 million units, months of supply will rise to 10.4 months.
I think these estimates are conservative (actual will probably be higher). For reference, the all time record high was 11.2 months of supply in 2008.
This level of supply will put additional downward pressure on house prices. Click on graph for larger image in new window.
This graph show months of supply and the annualized change in the Case-Shiller Composite 20 house price index.
Below 6 months of supply (blue line) house prices are typically rising (black line).
Above 6 or 7 months of supply house prices are usually falling (although there were many programs to support house prices over the last year).
The dashed red line is the estimate for months of supply in June and July.
This is a key reason why I expect house prices to fall further later this year as measured by the Case-Shiller and CoreLogic repeat sales house price indexes.
WSJ: Housing Market Stumbles
by Calculated Risk on 7/21/2010 08:55:00 AM
Nick Timiraos and Robbie Whelan write at the WSJ Housing Market Stumbles. A few excerpts:
The Wall Street Journal's quarterly survey of housing-market conditions in 28 major metropolitan areas shows that inventory levels have grown in many markets.A few comments:
... newly signed contracts in May and June have plunged. ...
More broadly, the housing market faces two big problems: too many homes and falling demand.
Monday, July 12, 2010
Condo Shadow Inventory
by Calculated Risk on 7/12/2010 11:30:00 PM
Another update on condos as shadow inventory ...
From Kelly Bennett at the Voice of San Diego: Vantage Pointe's Trouble Persists, but Downtown Thinks It's Found Bottom
Weighing in at 679 units, downtown's biggest condo building, Vantage Pointe, has met with outsize trouble since 2004 when buyers first got in fistfights for the privilege of securing a unit.This is another reminder that unless these condos are listed, they do not show up as either existing or new home inventory (the new home report doesn't include high rise condos).
The building's trouble continues. The developers haven't sold a single unit in the 14 months since returning deposits to the previous contracted buyers. About 40 buyers have signed contracts to buy there but can't close the deals. More than 150 other units are being rented.
But that's not enough to satisfy the project's lenders behind its $210 million loan, the largest construction loan on a single residential building in San Diego history. Those lenders filed a notice of default in April, pushing the developers to the first stage of foreclosure.
And 150 of these units have been rented and will probably be sold someday too. I spoke to a landlord in the downtown San Diego area yesterday, and she has had to cut rents significantly to compete with all the condo units being rented.
There are some areas - like Las Vegas and Miami - that have a huge number of vacant high rise condos. But there are also many smaller buildings that are mostly vacant in a number of cities (like in New York, Chicago, Raliegh, N.C. and Irvine, Ca). This is all part of the shadow inventory ...
Wednesday, June 30, 2010
Lawler: Residential Listings in June
by Calculated Risk on 6/30/2010 05:47:00 PM
CR Note: How the NAR calculates existing home inventory is a bit of a mystery. Housing economist Tom Lawler has been tracking inventory several different ways. The following post is from Tom Lawler:
This morning there were 3,973,439 residential listings on realtor.com, up 1.6% from late May and up 0.3% from a year ago. Listings in California, which declined sharply during 2009, were up 2.3% on the month and up 7.4% from a year ago. States with especially large monthly increases in listings including Washington (14.5%, after an 8.4% drop in May – Washington data are whacky!), Alaska (5.1%), Maine (4.9%), and Colorado (4.3%). Florida listings were up 0.3% on the month but down 9.5% from a year ago. Click on graph for larger image in new window.
I’m not sure how often realtor.com listings by states are “refreshed,” or whether the updates are identical across states. However, the realtor.com data appear to “synch up” better to reports from various MLS than do the monthly National Association of Realtor data – which often displays monthly swings completely out of whack with the various “inventory trackers” that I and others follow. The NAR wasn’t willing to give me details of its methodology, but it apparently uses the sample data from various realtor associations/boards/MLS, and it may estimate the national totals with gross-ups based on “months’ supply.” Whatever the case, the monthly NAR numbers appear to have “spurious volatility” unrelated to actual swings in listings.
CR Note: This seems to suggest an increase in inventory in June. Using Realtor.com isn't perfect, but it is a consistent and transparent method.
Sunday, June 27, 2010
Housing Supply Metrics
by Calculated Risk on 6/27/2010 08:13:00 PM
Here is a table of various housing supply measures (just putting this in one place with links to the source data).
Note: here is the Weekly Summary and a Look Ahead. It will be a busy week!
| Total delinquent loans1 | 7.3 million |
| Seriously delinquent loans1,2 | 5.0 million |
| Total REO Inventory3 | 0.5 million |
| Fannie, Freddie, FHA REO4 | 210 thousand |
| Homeowners with Negative Equity5 | 11.2 million |
| Homeowner vacancy rate6 | 2.6% |
| Rental vacancy rate6 | 10.6% |
| Excess Vacant Units6,7 | 1.7 million |
| Existing Home Inventory8 | 3.89 million |
| Existing Home Months of Supply8 | 8.3 months |
| New Home Inventory9 | 213 thousand |
| New Home Months of Supply9 | 8.5 months |
1 Source: estimate based on the Mortgage Bankers Association’s (MBA) Q1 2010 National Delinquency Survey. "MBA’s National Delinquency Survey covers about 44.4 million first lien mortgages on one-to four-unit residential properties ... The NDS is estimated to cover around 85 percent of the outstanding first-lien mortgages in the country."
2 This is based on the MBA's estimate of loans 90+ days delinquent or in the foreclosure process.
3 Source: Radarlogic and Barclays as of Feb 2010.
4 Source: Fannie Mae, Freddie Mac and FHA. Fannie, Freddie, FHA REO Inventory Surges 22% in Q1 2010
5 Source: CoreLogic Q1 2010 Negative Equity Report
6 Source: Census Bureau Residential Vacancies and Homeownership in the First Quarter 2010
7 CR calculation.
8 Source: National Association of Realtors
9 Source: Census Bureau New Residential sales
Tuesday, June 22, 2010
Existing Homes: Months of Supply and House Prices
by Calculated Risk on 6/22/2010 02:34:00 PM
Earlier I mentioned that a normal housing market usually has under 6 months of supply. The current 8.3 months of supply is significantly above normal, and is especially concerning because the reported inventory is already historically very high.
After the tax credit related activity ends, the months of supply will probably increase, and the ratio could be close to double digits later this year. That level of supply will put additional downward pressure on house prices.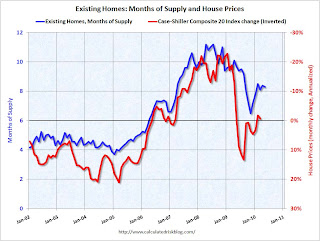 Click on graph for larger image in new window.
This graph show months of supply and the annualized change in the Case-Shiller Composite 20 house price index (inverted).
Below 6 months of supply (blue line) house prices are typically rising (red line, inverted).
Above 6 months of supply house prices are usually falling (although there were many programs to support house prices over the last year).
Later this year the months of supply will probably increase, and I expect house prices to fall further as measured by the Case-Shiller and CoreLogic repeat sales house price indexes.
Existing Home Sales: Inventory increases Year-over-Year
by Calculated Risk on 6/22/2010 11:28:00 AM
Earlier the NAR released the existing home sales data for May; here are a couple more graphs ...
The first graph shows the year-over-year (YoY) change in reported existing home inventory and months-of-supply. Inventory is not seasonally adjusted, so it really helps to look at the YoY change.  Click on graph for larger image in new window.
Inventory increased 1.1% YoY in May. This is the second consecutive month of a year-over-year increases in inventory. Although the YoY increase is small, I expect it will be higher later this year.
This increase in inventory is especially concerning because the reported inventory is already historically very high, and the 8.3 months of supply in May is well above normal. The months of supply will probably stay near this level in June, because of more tax credit related sales (reported at closing), but the months-of-supply could be close to double digits later this year.
And a double digit months-of-supply would be a really bad sign for house prices ... The second graph shows NSA monthly existing home sales for 2005 through 2010 (see Red columns for 2010).
Sales (NSA) in May 2010 were 17.7% higher than in May 2009, and also higher than in May 2008.
We will probably see sales at around this level in June because of the tax credit, however I expect to see existing home sales below last year in the 2nd half of this year.
This was definitely a weak report. Sales were up year-over-year because of the tax credit pulling sales forward, but that does very little for the economy. The key is the inventory and months-of-supply, and if these two measures increase later this year as I expect, then there will be additional downward pressure on house prices.
Existing Home Sales decline in May
by Calculated Risk on 6/22/2010 10:00:00 AM
The NAR reports: May Shows a Continued Strong Pace for Existing-Home Sales
Existing-home sales, which are completed transactions that include single-family, townhomes, condominiums and co-ops, were at a seasonally adjusted annual rate of 5.66 million units in May, down 2.2 percent from an upwardly revised surge of 5.79 million units in April. May closings are 19.2 percent above the 4.75 million-unit level in May 2009; April sales were revised to show an 8.0 percent monthly gain.
...
Total housing inventory at the end of May fell 3.4 percent to 3.89 million existing homes available for sale, which represents an 8.3-month supply at the current sales pace, compared with an 8.4-month supply in April. Raw unsold inventory is 1.1 percent above a year ago, but is still 14.9 percent below the record of 4.58 million in July 2008.
 Click on graph for larger image in new window.
This graph shows existing home sales, on a Seasonally Adjusted Annual Rate (SAAR) basis since 1993.
Sales in May 2010 (5.66 million SAAR) were 2.2% lower than last month, and were 19.2% higher than May 2009 (4.75 million SAAR).
 The second graph shows nationwide inventory for existing homes.
According to the NAR, inventory decreased to 3.89 million in May from 4.04 million in April. The all time record high was 4.58 million homes for sale in July 2008.
Inventory is not seasonally adjusted and there is a clear seasonal pattern with inventory increasing in the spring and into the summer. The increase in April 2010 was partially related to sellers hoping to take advantage of the housing tax credit, and a decline in May was expected (I'll have more on inventory later).
 The last graph shows the 'months of supply' metric.
Months of supply decreased slightly to 8.3 months in May. A normal market has under 6 months of supply, so this is high - and probably excludes some substantial shadow inventory. And the months of supply will probably increase sharply this summer as sales fade.
This was a very weak report - as anticpated by Tom Lawler yesterday (see Lawler: Home Sales in May: A Look at the Data ). I'll have more ...
Monday, June 21, 2010
Obama Housing Metrics
by Calculated Risk on 6/21/2010 03:48:00 PM
The Obama administration has introduced a "monthly housing scorecard". Here is the website: www.hud.gov/scorecard
Some excerpts and a couple of graphs:
• Home price performance has improved. After 30 straight months of decline and an expectation of continued significant deterioration, home prices have leveled off in the past year and expectations have adjusted upward. Homeowners have benefitted from the stabilization, as owner equity has increased by over $1 trillion since the first quarter of 2009
 Click on graph for larger image in new window.
This graph from the Obama Administration "scorecard" shows the actual house prices, and future house prices. The light blue line was the projected house prices based on futures in January 2009 - before the Obama administration started supporting house prices with various programs to limit supply and boost demand.
Note: I don't know why they use washed out colors on the graphs.
I believe the overall goal of supporting house prices was a mistake. It wasn't horrible - because prices were much closer to the bottom than the top - but by keeping prices too high, the market hasn't cleared and there is still a huge overhang of existing home inventory.
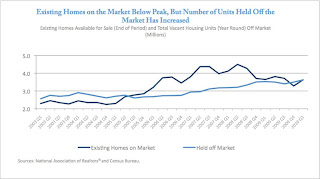 The second graph from the housing scorecard shows the Obama administration's estimate of the housing overhang.
 I'm not confident in the "held off market" category, but that is probably their method of estimating the shadow inventory (not all "held off market" is shadow, but some probably is). The existing home inventory - and shadow inventory - are still very high.
More from the report:
• More than 2.5 million first time homebuyers have purchased a home using the First-Time Homebuyer Tax credit, helping to stabilize home sales and prices and increase affordability.This is really sad news. This program was a disaster - most of these buyers would have bought anyway, and the others was just pulling forward future demand at a higher price. Now that the program is almost over (hopefully), demand and prices will probably fall again.
• Martgages are now more affordable. Due to historically low interest rates, more than 6 million homeowners have refinanced, saving an estimated $150 per month on overage and more than $11 billion in total.Note: the Obama administration needs a better spellchecker (what is a "martgage"?. And I think it is "benefited" with one "t")
• Servicers report that the number of homeowners receiving restructured mortgages since April 2009 has increased to 2.8 million. This includes more than 1.2 million homeowners who have started HAMP trial modifications and nearly 400,000 who have benefitted from FHA loss mitigation activities. Of those in the HAMP program, 346,000 have entered a permanent modification saving a median of more than $500 per month. In addition, HUD approved mortgage counselors have assisted 3.6 million families.
• Based on newly available survey data, nearly half of homeowners unable to enter a HAMP permanent modification enter an alternative modification with their servicer, and fewer than 10 percent of cancelled trials move to foreclosure sale.
This raises more questions: fewer than 10% of cancelled trials have moved to a foreclosure sale? What about short sales? Does that mean that the homeowners are curing the delinquency (getting caught up), or does that mean there are many more distressed sales to come?
There are many more graphs (and a list of sources) in the report and this report might not have much good news in the coming months ...
Monday, May 24, 2010
'Shadow' Condos coming back on market
by Calculated Risk on 5/24/2010 02:16:00 PM
Over the weekend, Jeff Collins at the O.C. Register noted that the "Central Park West" complex in Irvine, California that was mothballed by Lennar in 2007 is now back on the market.
And from Amanda Fung at Crain's New York: 'Shadow' condos dim sale outlook (ht Nick)
A little over two years ago, SDS Procida suspended plans to market The Dillon, its 83-unit Hell's Kitchen condo, when residential real estate tanked ... the developer finally put the units on the block three weeks ago.The term "shadow inventory" is used in many different ways. My definition is: housing units that are not currently listed on the market, but will probably be listed soon. This includes:
...
“It is still early—you're not seeing a flood of apartments yet—but we may see it happen during the second half of the year,” says Jonathan Miller, chief executive of appraisal firm Miller Samuel Inc.
...
Mr. Miller estimates that there were 6,500 units of shadow space in Manhattan alone during the first quarter of this year. If those apartments were unloaded all at once, supply would potentially skyrocket by 70%.
It is difficult to put a number on the total, but it is in the millions of units and all this inventory will keep downward pressure on house prices for some time.
Existing Home Sales: Inventory increases Year-over-Year
by Calculated Risk on 5/24/2010 11:25:00 AM
Earlier the NAR released the existing home sales data for April; here are a couple more graphs ...
The first graph shows the year-over-year (YoY) change in reported existing home inventory and months-of-supply. Inventory is not seasonally adjusted, so it really helps to look at the YoY change.  Click on graph for larger image in new window.
Inventory increased 2.7% YoY in April, the first YoY increase since 2008.
This increase in the inventory is especially concerning because the reported inventory is already historically very high, and the 8.4 months of supply in April is well above normal. The months of supply will probably decline over the next two months because of the increase in sales due to the tax credit (reported at closing), but this will be something to watch this summer and later this year.
Perhaps this was an especially large surge in inventory as sellers tried to take advantage of the tax credit, but it is also possible that we will see close to double digit months of supply later this year.  The second graph shows NSA monthly existing home sales for 2005 through 2010 (see Red columns for 2010).
Sales (NSA) in April 2010 were 26% higher than in April 2009, and also higher than in April of 2007 and 2008.
We will probably see an increase in sales in May and June - perhaps to the levels of 2006 or 2007 - because of the tax credit, however I expect to see existing home sales below last year in the 2nd half of this year.
I think this was a weak report. Sales were up because of the tax credit (pulling sales forward), but that does very little for the economy. The key is the increase in the inventory and months-of-supply, and if these two measures increase later this year (after the distortions in May and June), then there will be additional downward pressure on house prices.
Existing Home Sales increase in April
by Calculated Risk on 5/24/2010 10:00:00 AM
The NAR reports: Existing-Home Sales Rise
Existing-home sales, which are completed transactions that include single-family, townhomes, condominiums and co-ops, increased 7.6 percent to a seasonally adjusted annual rate of 5.77 million units in April from an upwardly revised 5.36 million in March, and are 22.8 percent higher than the 4.70 million-unit pace in April 2009.
...
Total housing inventory at the end of April rose 11.5 percent to 4.04 million existing homes available for sale, which represents an 8.4-month supply at the current sales pace, up from an 8.1-month supply in March.
 Click on graph for larger image in new window.
This graph shows existing home sales, on a Seasonally Adjusted Annual Rate (SAAR) basis since 1993.
Sales in April 2010 (5.77 million SAAR) were 7% higher than last month, and were 22.8% higher than April 2009 (4.61 million SAAR).
Sales surged last November when many first-time homebuyers rushed to beat the initial expiration of the tax credit. There will probably be a further increase in May and June this year. Note: existing home sales are counted at closing, so even though contracts must be signed in April to qualify for the tax credit, buyers have until June 30th to close.
 The second graph shows nationwide inventory for existing homes.
According to the NAR, inventory increased to 4.04 million in April from 3.63 million in March. The all time record high was 4.57 million homes for sale in July 2008.
Inventory is not seasonally adjusted and there is a clear seasonal pattern - inventory should increase further in the spring. This is an increase from April 2009, and this breaks a streak of 20 consecutive months of year-over-year declines in inventory (I'll have more on inventory).
 The last graph shows the 'months of supply' metric.
Months of supply increased to 8.4 months in April. A normal market has under 6 months of supply, so this is high - and probably excludes some substantial shadow inventory. And the months of supply will probably increase sharply this summer.
I'll have more later ... the increase in inventory is the big story.
Thursday, April 22, 2010
More on Existing Home Sales and Inventory
by Calculated Risk on 4/22/2010 11:19:00 AM
Earlier the NAR released the existing home sales data for March; here are a couple more graphs ...
The first graph shows the year-over-year change in reported existing home inventory and months-of-supply. Click on graph for larger image in new window.
There was a rapid increase in inventory in the 2nd half of 2005 (that helped me call the peak of the bubble). Then the increase in inventory steadily slowed.
The YoY inventory has been decreasing for the last 20 months. However the YoY decline is getting smaller - only 1.8% in March.
This slow decline in the inventory is especially concerning with the large reported inventory and 8.0 months of supply in March - well above normal. Of course months of supply will decline over the next few months because of the increase in sales due to the tax credit, but this will be something to watch this summer and later this year. The second graph shows NSA monthly existing home sales for 2005 through 2010 (see Red columns for 2010).
Sales (NSA) in March 2010 were 19.6% higher than in March 2009, and also higher than in March 2008.
We will probably see an increase in sales in May and June - perhaps to the levels of 2006 or 2007 - because of the tax credit, however I expect to see existing home sales below last year in the 2nd half of this year.
Existing Home Sales increase in March
by Calculated Risk on 4/22/2010 10:00:00 AM
The NAR reports: Existing-Home Sales Rise
Existing-home sales, which are completed transactions that include single-family, townhomes, condominiums and co-ops, rose 6.8 percent to a seasonally adjusted annual rate of 5.35 million units in March from 5.01 million in February, and are 16.1 percent above the 4.61 million-unit level in March 2009.
...
Total housing inventory at the end of March rose 1.5 percent to 3.58 million existing homes available for sale, which represents an 8.0-month supply at the current sales pace, down from an 8.5-month supply in February.
 Click on graph for larger image in new window.
This graph shows existing home sales, on a Seasonally Adjusted Annual Rate (SAAR) basis since 1993.
Sales in March 2010 (5.35 million SAAR) were 6.8% higher than last month, and were 16.1% higher than March 2009 (4.61 million SAAR).
Sales surged last November when many first-time homebuyers rushed to beat the initial expiration of the tax credit. There will probably be another increase in May and June this year, although that will be probably be smaller than the November increase. Note: existing home sales are counted at closing, so even though contracts must be signed in April to qualify for the tax credit, buyers have until June 30th to close.
 The second graph shows nationwide inventory for existing homes.
According to the NAR, inventory increased to 3.58 million in March from 3.53 million in February. The all time record high was 4.57 million homes for sale in July 2008.
Inventory is not seasonally adjusted and there is a clear seasonal pattern - inventory should increase further in the spring. This was the 20th consecutive month of reported year-over-year decline in inventory, but the decline was only 1.8% from March 2009.
 The last graph shows the 'months of supply' metric.
Months of supply decreased to 8.0 months in March.
A normal market has under 6 months of supply, so this is high - and probably excludes some substantial shadow inventory.
I'll have more later ...
Tuesday, March 23, 2010
More on Existing Home Sales and Inventory
by Calculated Risk on 3/23/2010 11:22:00 AM
Earlier the NAR released the existing home sales data for February; here are a couple more graphs ...  Click on graph for larger image in new window.
This graph shows NSA monthly existing home sales for 2005 through 2010 (see Red columns for 2010).
Sales (NSA) in February 2010 were 7.9% higher than in February 2009, and 3.2% lower than in February 2008.
We will probably see an increase in sales in May and June because of the tax credit, however I expect to see existing home sales below last year later this year.
The second graph shows the Year-over-year change in reported existing home inventory. There was a rapid increase in inventory in the 2nd half of 2005 (that helped me call the peak of the bubble), and the YoY inventory has been decreasing for the last 19 months. However the YoY decline is getting smaller - even with a large reported inventory (and probably more shadow inventory). This is something to watch.
This slow decline in the inventory is especially concerning with 8.6 months of supply in February - well above normal.
Existing Home Sales Decline in February
by Calculated Risk on 3/23/2010 10:00:00 AM
The NAR reports: February Existing-Home Sales Ease with Mixed Conditions Around the Country
Existing-home, which are finalized transactions that include single-family, townhomes, condominiums and co-ops, slipped 0.6 percent nationally to a seasonally adjusted annual rate of 5.02 million units in February from 5.05 million in January, but are 7.0 percent higher than the 4.69 million-unit pace in February 2009.
...
Total housing inventory at the end of February rose 9.5 percent to 3.59 million existing homes available for sale, which represents an 8.6-month supply at the current sales pace, up from a 7.8-month supply in January. Raw unsold inventory is 5.5 percent below a year ago.
 Click on graph for larger image in new window.
This graph shows existing home sales, on a Seasonally Adjusted Annual Rate (SAAR) basis since 1993.
Sales in February 2010 (5.02 million SAAR) were 0.6% lower than last month, and were 7.0% higher than February 2009 (4.69 million SAAR).
Sales surged last November when many first-time homebuyers rushed to beat the initial expiration of the tax credit. There will probably be another increase in May and June this year, although that will be probably be smaller than the November increase. Note: existing home sales are counted at closing, so even though contracts must be signed in April to qualify for the tax credit, buyers have until June 30th to close.
 The second graph shows nationwide inventory for existing homes.
According to the NAR, inventory increased to 3.59 million in February from 3.27 million in January. The all time record high was 4.57 million homes for sale in July 2008.
Inventory is not seasonally adjusted and there is a clear seasonal pattern - inventory should increase further in the spring.
 The last graph shows the 'months of supply' metric.
Months of supply increased to 8.6 months in February.
A normal market has under 6 months of supply, so this is high - and probably excludes some substantial shadow inventory.
I'll have more later ...
Friday, February 26, 2010
Existing Home Sales Decline Sharply in January
by Calculated Risk on 2/26/2010 10:00:00 AM
The NAR reports: Existing-Home Sales Down in January
Existing-home sales – including single-family, townhomes, condominiums and co-ops – dropped 7.2 percent to a seasonally adjusted annual rate1 of 5.05 million units in January from a revised 5.44 million in December, but remain 11.5 percent above the 4.53 million-unit level in January 2009.
Total housing inventory at the end of January fell 0.5 percent to 3.27 million existing homes available for sale, which represents a 7.8-month supply at the current sales pace, up from a 7.2-month supply in December.
 Click on graph for larger image in new window.
This graph shows existing home sales, on a Seasonally Adjusted Annual Rate (SAAR) basis since 1993.
Sales in Jan 2010 (5.05 million SAAR) were 7.2% lower than last month, and were 11.5% higher than Jan 2009 (4.53 million SAAR).
This is a sharp drop from November when many of the transactions were due to first-time homebuyers rushing to beat the initial expiration of the tax credit (that has been extended). That pushed sales far above the historical normal level; based on normal turnover, existing home sales would be in the 4.5 to 5.0 million SAAR range.
 The second graph shows nationwide inventory for existing homes. According to the NAR, inventory decreased to 3.27 million in January from 3.29 million in December. The all time record high was 4.57 million homes for sale in July 2008.
 This is not seasonally adjusted and this decline is mostly seasonal - inventory should increase in the Spring.
 The third graph shows the 'months of supply' metric.
Months of supply increased to 7.8 months in January.
A normal market has under 6 months of supply, so this is high - and probably excludes some substantial shadow inventory.
I'll have more later ...
Tuesday, January 26, 2010
Existing Home Inventory: A long way from Normal
by Calculated Risk on 1/26/2010 09:56:00 PM
James Hagerty at the WSJ writes about existing home inventory: Housing Momentum Builds but Perils Persist
Inventories of homes listed for sale are down sharply across the U.S. and have reached very low levels in some areas ... The decrease in supplies has sparked a return of bidding wars on lower-end properties in some neighborhoods, but the national picture is mixed.We've been discussing the bidding wars on low end properties since last spring - and that frenzy was driven by a combination of a high number of foreclosures at the low end pushing down prices (what housing economist Tom Lawler called "destickification"), and the first time home buyer tax credit. In some areas - like San Diego - the frenzy has moved up to more expensive areas.
But the national picture is still ugly.
 Click on graph for larger image in new window.
 This graph shows nationwide inventory for existing homes. According to the NAR, inventory decreased to 3.29 million in December from 3.52 million in November. This is not seasonally adjusted and December is usually the lowest month of the year - and this decline was mostly seasonal.
Inventory levels are still well above normal even though the number of units For Sale has been falling for some time.
 The second graph shows the year-over-year percentage change in inventory and the months of supply.
Note the sharp increase in mid-2005 - that was one of the signals that helped me call the end of the boom phase of the housing bubble.
The YoY change has been negative since mid-2008, indicating that inventory is declining. However the months of supply is still above normal (usually 4 to 6 months), even with sales (the denominator) being pushed artificially high.
In a normal market, sales would be about 6% of owner occupied units per year, or close to 5 million units per year. Six months of inventory would be something under 2.5 million units - so at 3.3 million, the level of inventory is still a long way from normal. And this doesn't include all the various shadow inventory that will come on the market.
In a normal year, inventory starts to increase in January (many homeowners remove their homes from the market during the holidays). I wouldn't be surprised if the YoY change was no longer negative some time early in 2010. And I'd expect inventory levels to be above normal levels for an extended period.
Monday, January 25, 2010
Existing Home Sales decline Sharply in December
by Calculated Risk on 1/25/2010 10:00:00 AM
The NAR reports: December Existing-Home Sales Down but Prices Rise; 2009 Sales Up
Existing-home sales – including single-family, townhomes, condominiums and co-ops – fell 16.7 percent to a seasonally adjusted annual rate of 5.45 million units in December from 6.54 million in November, but remain 15.0 percent above the 4.74 million-unit level in December 2008.
For all of 2009 there were 5,156,000 existing-home sales, which was 4.9 percent higher than the 4,913,000 transactions recorded in 2008; it was the first annual sales gain since 2005.
...
Total housing inventory at the end of December fell 6.6 percent to 3.29 million existing homes available for sale, which represents a 7.2-month supply at the current sales pace, up from a 6.5-month supply in November.
 Click on graph for larger image in new window.
This graph shows existing home sales, on a Seasonally Adjusted Annual Rate (SAAR) basis since 1993.
Sales in Dec 2009 (5.45 million SAAR) were 16.7% lower than last month, and were 15% higher than Dec 2008 (4.74 million SAAR).
Of course many of the transactions in November were due to first-time homebuyers rushing to beat the initial expiration of the tax credit (that has now been extended). That pushed sales far above the historical normal level; based on normal turnover, existing home sales would be in the 4.5 to 5.0 million SAAR range.
The second graph shows nationwide inventory for existing homes. According to the NAR, inventory decreased to 3.29 million in December from 3.52 million in November. The all time record high was 4.57 million homes for sale in July 2008. This is not seasonally adjusted and December is usually the lowest month of the year - so this decline is mostly seasonal.
 The third graph shows the 'months of supply' metric for the last six years.
Months of supply increased to 7.2 months in December.
A normal market has under 6 months of supply, so this is still high.
This decline was expected. I'll have more later ... but remember to ignore the median prices (that is distorted by the mix), and to focus more on new home sales than existing home sales.


