 RSS Feed
 by Calculated Risk on 6/22/2010 02:34:00 PM
Tuesday, June 22, 2010
Existing Homes: Months of Supply and House Prices
Earlier I mentioned that a normal housing market usually has under 6 months of supply. The current 8.3 months of supply is significantly above normal, and is especially concerning because the reported inventory is already historically very high.
After the tax credit related activity ends, the months of supply will probably increase, and the ratio could be close to double digits later this year. That level of supply will put additional downward pressure on house prices.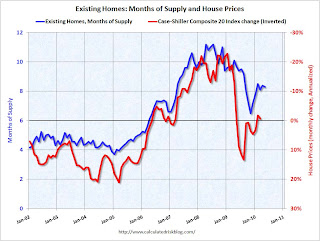 Click on graph for larger image in new window.
This graph show months of supply and the annualized change in the Case-Shiller Composite 20 house price index (inverted).
Below 6 months of supply (blue line) house prices are typically rising (red line, inverted).
Above 6 months of supply house prices are usually falling (although there were many programs to support house prices over the last year).
Later this year the months of supply will probably increase, and I expect house prices to fall further as measured by the Case-Shiller and CoreLogic repeat sales house price indexes.


