 RSS Feed
 by Calculated Risk on 6/04/2010 09:59:00 AM
Showing posts with label Employment. Show all posts
Showing posts with label Employment. Show all posts
Friday, June 04, 2010
Employment-Population Ratio, Part Time Workers, Unemployed over 26 Weeks
Here are a few more graphs based on the employment report ...
Percent Job Losses During Recessions, aligned at Bottom Click on graph for larger image.
This graph shows the job losses from the start of the employment recession, in percentage terms - but this time aligned at the bottom of the recession.
The current recession bounced along the bottom for a few months - so the choice of bottom is a little arbitrary (plus or minus a month or two).
Notice that the 1990 and 2001 recessions were followed by jobless recoveries - and the eventual job recovery was gradual. In earlier recessions the recovery was somewhat similar and a little faster than the decline (somewhat symmetrical).
The dotted line shows the impact of Census hiring. In May, there were 564,000 temporary 2010 Census workers on the payroll. Starting in June, the number of Census workers will decline - and the two red lines will meet later this year.
Employment-Population Ratio
The Employment-Population ratio decreased to 58.7% in May (from 58.8% in April). This had been increasing after plunging since the start of the recession. This is about the same level as in December 1983. This graph shows the employment-population ratio; this is the ratio of employed Americans to the adult population.
Note: the graph doesn't start at zero to better show the change.
The Labor Force Participation Rate decreased to 65.0% from 65.2% in April. This is the percentage of the working age population in the labor force. This decline is disappointing, and the rate is well below the 66% to 67% rate that was normal over the last 20 years.
The reason the unemployment rate declined was because people left the workforce - and that is not good news. As the employment picture improves, people will return to the labor force, and that will put upward pressure on the unemployment rate.
Part Time for Economic Reasons 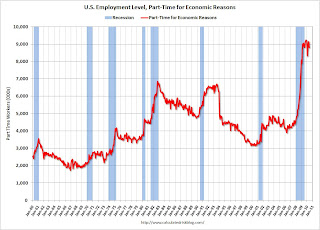 From the BLS report:
The number of persons employed part time for economic reasons (some-times referred to as involuntary part-time workers) declined by 343,000 in May to 8.8 million. These individuals were working part time because their hours had been cut back or because they were unable to find a full-time job.The number of workers only able to find part time jobs (or have had their hours cut for economic reasons) was at 8.809 million in April. This decline was a little bit of good news.
The all time record of 9.24 million was set in October.
These workers are included in the alternate measure of labor underutilization (U-6) that was at 16.6% in May.
Unemployed over 26 Weeks
 The blue line is the number of workers unemployed for 27 weeks or more. The red line is the same data as a percent of the civilian workforce.
According to the BLS, there are a record 6.763 million workers who have been unemployed for more than 26 weeks (and still want a job). This is a record 4.38% of the civilian workforce. (note: records started in 1948). It does appear the increases are slowing ...
Although the headline number of 431,000 payroll jobs was large, this was only 20,000 after adjusting for the 411,000 Census 2010 temporary hires. The underlying details were mixed. The positives: the unemployment rated decreased to 9.7%, the number of part time workers (for economic reasons) decreased helping to push down U-6 to 16.6% (from 17.1%), hourly wages increased (slightly), as did the average hours worked.
Negatives include the employment-population rate declining, the few payroll jobs ex-Census, and a record number of workers unemployed for more than 26 weeks. The number of long term unemployed is one of the key stories of this recession, especially since many of them are now losing their unemployment benefits.
I'll have even more later ...
Earlier employment post today:
May Employment Report: 20K Jobs ex-Census, 9.7% Unemployment Rate
by Calculated Risk on 6/04/2010 08:30:00 AM
From the BLS:
Total nonfarm payroll employment grew by 431,000 in May, reflecting the hiring of 411,000 temporary employees to work on Census 2010, the U.S. Bureau of Labor Statistics reported today. ... The unemployment rate edged down to 9.7 percent.Census 2010 hiring was 411,000 in May. Non-farm payroll employment increased 20,000 in May ex-Census.
 Click on graph for larger image.
This graph shows the unemployment rate and the year over year change in employment vs. recessions.
Nonfarm payrolls increased by 431,000 in May. The economy has lost 0.6 million jobs over the last year, and 7.4 million jobs since the recession started in December 2007. Ex-Census hiring, the economy only added 20,000 jobs in May.
The unemployment rate decreased to 9.7 percent.
 The second graph shows the job losses from the start of the employment recession, in percentage terms (as opposed to the number of jobs lost).
The dotted line is ex-Census hiring. The two lines will rejoin later this year when the Census hiring is unwound.
For the current recession, employment peaked in December 2007, and this recession is by far the worst recession since WWII in percentage terms, and 2nd worst in terms of the unemployment rate (only early '80s recession with a peak of 10.8 percent was worse).
This is a very weak report. The decrease in the unemployment rate was because of a decline in the participation rate - and that is not good news. I'll have much more soon ...
Thursday, June 03, 2010
Weekly Initial Unemployment Claims at 453,000
by Calculated Risk on 6/03/2010 08:30:00 AM
The DOL reports on weekly unemployment insurance claims:
In the week ending May 29, the advance figure for seasonally adjusted initial claims was 453,000, a decrease of 10,000 from the previous week's revised figure of 463,000. The 4-week moving average was 459,000, an increase of 1,750 from the previous week's revised average of 457,250.
...
The advance number for seasonally adjusted insured unemployment during the week ending May 22 was 4,666,000, an increase of 31,000 from the preceding week's revised level of 4,635,000.
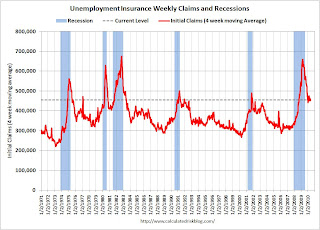
 Click on graph for larger image in new window.
This graph shows the 4-week moving average of weekly claims since 1971.
The four-week average of weekly unemployment claims increased this week by 1,750 to 459,000.
The dashed line on the graph is the current 4-week average. The current level of 453,000 (and 4-week average of 459,000) is still high, and suggests ongoing weakness in the labor market.
David Greenlaw at Morgan Stanley offered some possible reasons that claims have stayed elevated such as more ineligible filers and that "construction workers tend to file more frequently", although I'm not convinced. This is still disappointing ... the 4-week average has been moving sideways since December.
ADP: Private Employment increased 55,000 in May
by Calculated Risk on 6/03/2010 08:15:00 AM
ADP reports:
Nonfarm private employment increased 55,000 from April to May 2010 on a seasonally adjusted basis, according to the ADP National Employment Report. The estimated change in employment from March to April 2010 was revised, from an increase of 32,000 to an increase of 65,000.Note: ADP is private nonfarm employment only (no government jobs).
May’s rise in private employment was the fourth consecutive monthly gain. However, over these four months the increases have averaged a modest 39,000. The slow pace of improvement from February through May is consistent with the pause in the decline of initial unemployment claims that occurred during the winter months.
This is close to the consensus forecast of ADP showing an increase of 60,000 private sector jobs in May.
The BLS reports tomorrow, and the consensus is for an increase of 540,000 payroll jobs in May, on a seasonally adjusted (SA) basis, with over 400,000 temporary Census 2010 jobs.
Tuesday, June 01, 2010
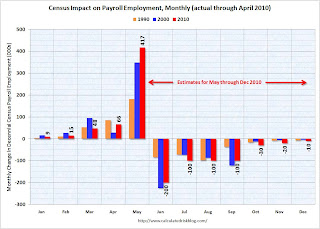
Impact of Census 2010 on Payroll Report
by Calculated Risk on 6/01/2010 02:49:00 PM
We are starting to see articles like this from CNBC: Strong Jobs Number on Friday Could Give the Markets a Boost
Economists expect the US economy generated about 540,000 jobs in May—a large portion of which expected to come from Census hiring—and many analysts will be hoping that's enough to assuage investor fears that the European debt contagion could cause a double-dip recession.The BLS will release the May employment report on Friday. The consensus is for a gain of 540,000 payroll jobs in May, and for the unemployment rate to decline slightly to 9.8% (from 9.9%).
As the CNBC article noted, a large portion of the payroll jobs in May will be temporary hires for Census 2010 (May is the peak month). It will be important to remove the Census hiring to try to determine the underlying trend.
We can estimate the Census hiring using weekly payroll data from the Census bureau (ht Bob_in_MA). If we subtract the number of Temporary 2010 Census Workers in the 2nd week of May from the number in the second week of April, this suggests the Census boost will be around 417K in May. The Census Bureau will release the actual number with the employment report.
 Click on graph for larger image in new window.
This graph shows the actual impact of Census hiring in 1990, 2000, and through April 2010. The impact of the Census hiring, from May through December 2010, are my preliminary estimates.
When the employment report is released on Friday, a key number will be payroll jobs ex-Census - since the Census will probably add over 400,000 temporary payroll jobs (these are real jobs, but they mask the underlying trend). This temporary hiring will also push down the unemployment rate in May by 0.1% or 0.2% based on previous decennial Census hiring.
Most ex-Census forecasts are in the 130,000 to 150,000 range (although most forecasts only release the headline number). This would be a decrease from the 224,000 ex-Census payroll jobs in April.
Starting in June, the Census will negatively impact the payroll report. My preliminary estimate is for a decline of 200,000 Census payroll jobs in June (see graph above). If the underlying trend is a positive 200,000 payroll jobs, the headline number will be zero! And that will understate the underlying trend, just like the 500,000+ will overstate the trend in May. So we will need to adjust for the decennial Census for most of this year.
Sunday, May 30, 2010
Percent Job Losses During Recessions, aligned at Bottom
by Calculated Risk on 5/30/2010 05:17:00 PM
By request ... here is an update through April with the impact of Census hiring added. Click on graph for larger image.
This graph shows the job losses from the start of the employment recession, in percentage terms - but this time aligned at the bottom of the recession. This assumes that the 2007 recession has reached bottom.
The current recession has been bouncing along the bottom for a few months - so the choice of bottom is a little arbitrary (plus or minus a month or two).
Notice that the 1990 and 2001 recessions were followed by jobless recoveries - and the eventual job recovery was gradual. In earlier recessions the recovery was somewhat similar and a little faster than the decline (somewhat symmetrical).
The dotted line shows the impact of Census hiring.
In April, there were 154,000 temporary 2010 Census workers on the payroll. This barely shows up on the graph.
The number of temporary workers will jump to around 573,000 in May - and the dotted line will be well below the red line. Starting in June, the number of Census workers will decline - and the two lines will meet later this year.
Thursday, May 27, 2010
Weekly Initial Unemployment Claims at 460,000
by Calculated Risk on 5/27/2010 08:30:00 AM
The DOL reports on weekly unemployment insurance claims:
In the week ending May 22, the advance figure for seasonally adjusted initial claims was 460,000, a decrease of 14,000 from the previous week's revised figure of 474,000. The 4-week moving average was 456,500, an increase of 2,250 from the previous week's revised average of 454,250.
...
The advance number for seasonally adjusted insured unemployment during the week ending May 15 was 4,607,000, a decrease of 49,000 from the preceding week's revised level of 4,656,000.
 Click on graph for larger image in new window.
This graph shows the 4-week moving average of weekly claims since 1971.
The four-week average of weekly unemployment claims increased this week by 2,250 to 456,500.
The dashed line on the graph is the current 4-week average. The current level of 460,000 (and 4-week average of 456,500) is still high, and suggests ongoing weakness in the labor market.
Still disappointing ... the 4-week average has been moving sideways for almost five months.
Friday, May 21, 2010
April State Unemployment Rates: California and Nevada at series highs
by Calculated Risk on 5/21/2010 10:00:00 AM
From the BLS: Regional and State Employment and Unemployment Summary
Regional and state unemployment rates were generally little changed or slightly lower in April. Thirty-four states and the District of Columbia recorded unemployment rate decreases, 6 states had increases, and 10 states had no change. ...
Michigan again recorded the highest unemployment rate among the states, 14.0 percent in April. The states with the next highest rates were Nevada, 13.7 percent; California, 12.6 percent; and Rhode Island, 12.5 percent. North Dakota continued to register the lowest jobless rate, 3.8 percent, followed by South Dakota and Nebraska, 4.7 and 5.0 percent, respectively. The rate in Nevada set a new series high.
emphasis added
 Click on graph for larger image in new window.
This graph shows the high and low unemployment rates for each state (and D.C.) since 1976. The red bar is the current unemployment rate (sorted by the current unemployment rate).
Sixteen states and D.C. now have double digit unemployment rates. New Jersey is close.
Nevada set a new series high; California tied the previous record (since 1976).
Thursday, May 20, 2010
Weekly Initial Unemployment Claims Increase 25,000
by Calculated Risk on 5/20/2010 08:30:00 AM
The DOL reports on weekly unemployment insurance claims:
In the week ending May 15, the advance figure for seasonally adjusted initial claims was 471,000, an increase of 25,000 from the previous week's revised figure of 446,000. The 4-week moving average was 453,500, an increase of 3,000 from the previous week's unrevised average of 450,500.
...
The advance number for seasonally adjusted insured unemployment during the week ending May 8 was 4,625,000, a decrease of 40,000 from the preceding week's revised level of 4,665,000.
 Click on graph for larger image in new window.
This graph shows the 4-week moving average of weekly claims since 1971.
The four-week average of weekly unemployment claims increased this week by 3,000 to 453,500.
The dashed line on the graph is the current 4-week average. The 4-week average first declined to this level at the end of December 2009, and has been at this level for almost five months. The current level of 471,000 (and 4-week average of 453,500) is still high, and suggests ongoing weakness in the labor market.
Thursday, May 13, 2010
Weekly Initial Unemployment Claims at 444,000
by Calculated Risk on 5/13/2010 08:33:00 AM
The DOL reports on weekly unemployment insurance claims:
In the week ending May 8, the advance figure for seasonally adjusted initial claims was 444,000, a decrease of 4,000 from the previous week's revised figure of 448,000 [revised up from 444,000]. The 4-week moving average was 450,500, a decrease of 9,000 from the previous week's revised average of 459,500.
The advance number for seasonally adjusted insured unemployment during the week ending May 1 was 4,627,000, an increase of 12,000 from the preceding week's revised level of 4,615,000..
 Click on graph for larger image in new window.
This graph shows the 4-week moving average of weekly claims since 1971.
The four-week average of weekly unemployment claims decreased this week by 9,000 to 450,500.
The dashed line on the graph is the current 4-week average. The current level of 444,000 (and 4-week average of 450,500) is still high, and suggests ongoing weakness in the labor market.
Although declining over the last few weeks, the 4-week average first declined to this level at the end of December 2009, and has been at this level for almost five months.
Tuesday, May 11, 2010
BLS: Low Labor Turnover, More Hiring in March
by Calculated Risk on 5/11/2010 10:00:00 AM
From the BLS: Job Openings and Labor Turnover Summary
There were 2.7 million job openings on the last business day of March 2010, the U.S. Bureau of Labor Statistics reported today. The job openings rate was unchanged over the month at 2.0 percent. The hires rate (3.3 percent) was little changed, and the separations rate (3.1 percent) was unchanged in March.Note: The difference between JOLTS hires and separations is similar to the CES (payroll survey) net jobs headline numbers. The CES (Current Employment Statistics, payroll survey) is for positions, the CPS (Current Population Survey, commonly called the household survey) is for people.
The following graph shows job openings (purple), hires (blue), Total separations (include layoffs, discharges and quits) (red) and Layoff, Discharges and other (yellow) from the JOLTS.
Unfortunately this is a new series and only started in December 2000.
 Click on graph for larger image in new window.
Notice that hires (blue) and separations (red) are pretty close each month. This is the level of turnover each month. Right now about 4 million people lose their jobs each month, and a little over 4 million are hired (this is the labor turnover in the economy).
When the hires (blue line) is above total separations (as in March), the economy is adding net jobs, when the blue line is below total separations, the economy is losing net jobs.
According to the JOLTS report, there were 4.242 million hires in March (SA), and 4.016 million total separations, or 226 thousand net jobs gained. The comparable CES report showed a gain of 230 thousand jobs in March (after revision).
Layoffs and discharges have declined sharply from early 2009 - and that is a good sign.
Hiring picked up in March, although the number of job openings is still very low, as is the turnover rate.
Saturday, May 08, 2010
Duration of Unemployment
by Calculated Risk on 5/08/2010 01:14:00 PM
 This graph shows the duration of unemployment as a percent of the civilian labor force. The graph shows the number of unemployed in four categories as provided by the BLS: less than 5 week, 6 to 14 weeks, 15 to 26 weeks, and 27 weeks or more.
Note: The BLS reports 15+ weeks, so the 15 to 26 weeks number was calculated.
This really shows the change in turnover - there was more turnover in the '70s and '80s, since the 'less than 5 weeks' category was much higher as a percent of the civilian labor force than in recent years. This changed in the early '90s - perhaps as a result of more careful hiring practices or changes in demographics or maybe other reasons - but if the level of normal turnover was the same as in the '80s, the current unemployment rate would probably be the highest since WWII.
What really makes the current period stand out is the number of people (and percent) that have been unemployed for 27 weeks or more. In the early '80s, the 27 weeks or more unemployed peaked at 2.9 million or 2.6% of the civilian labor force.
In April 2010, there were 6.72 million people unemployed for 27 weeks or more, or 4.34% of the labor force. This is significantly higher than during earlier periods.
It is worth repeating some of the comments Atlanta Fed President Dennis Lockhart made in March:
There are two key types of match inefficiency. One is geographic mismatch. In 2008, the percentage of individuals living in a county or state different than the previous year was the lowest recorded in more than 50 years of data. People may be reluctant to relocate for a new job if the value of their house has declined. In addition, many who would like to move are under water in their mortgage or can't sell their homes.Both of these mismatches are contributing to the long term unemployment problem - and the housing bubble was a direct cause of both. Usually people can move freely in the U.S. to pursue employment (geographic mobility), but now many people are tied to an anchor (their home). And many workers went into the construction trades and acquired skills that are not easily transferable.
The second inefficiency is skills mismatch. In simple terms, the skills people have don't match the jobs available. Coming out of this recession there may be a more or less permanent change in the composition of jobs.
The good news is the economy is now adding jobs. But the lack of mobility and the skills mismatch make the long term unemployment problem a difficult challenge.
Friday, May 07, 2010
Temporary Help and Diffusion Index
by Calculated Risk on 5/07/2010 12:51:00 PM
Here are a couple more graphs based on data in the employment report ...
Temporary Help
From the BLS report:
Temporary help services continued to add jobs (26,000); employment in this industry has increased by 330,000 since September 2009.
 This graph is a little complicated. The red line is the three month average change in temporary help services (left axis). This is shifted four months into the future.
The blue line (right axis) is the three month average change in total employment (excluding temporary help services).
Unfortunately the data on temporary help services only goes back to 1990, but it does appear that temporary help leads employment by about four months.
The thinking is that before companies hire permanent employees following a recession, employers will first increase the hours worked of current employees (hours worked increased slightly in April) and also hire temporary employees. Since the number of temporary workers increased sharply over the last seven months, some people think this might be signaling the beginning of a strong employment recovery.
However, there has been some evidence of a shift by employers to more temporary workers, and the saying may become "We are all temporary now!", so use this increase with caution.
Note that the temporary hiring for the Census is excluded from this graph.
Diffusion Index
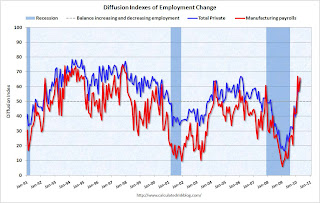 The BLS diffusion index for total private employment increased to 64.3 from 57.8 in March. This is the highest level since 2006. For manufacturing, the diffusion index is at 65.9; the highest since 1998.
Think of this as a measure of how widespread job gains are across industries. The further from 50 (above or below), the more widespread the job losses or gains reported by the BLS. From the BLS:
Figures are the percent of industries with employment increasing plus one-half of the industries with unchanged employment, where 50 percent indicates an equal balance between industries with increasing and decreasing employment.This fits with the headline payroll report and is a positive.
Earlier employment posts today:
Employment-Population Ratio, Part Time Workers, Unemployed over 26 Weeks
by Calculated Risk on 5/07/2010 09:59:00 AM
Here are a few more graphs based on the employment report ...
Employment-Population Ratio
The Employment-Population ratio increased to 58.8% in April (from 58.6% in March), after plunging since the start of the recession. This is about the same level as in December 1983. Click on graph for larger image in new window.
This graph shows the employment-population ratio; this is the ratio of employed Americans to the adult population.
Note: the graph doesn't start at zero to better show the change.
The general upward trend from the early '60s was mostly due to women entering the workforce.
The Labor Force Participation Rate increased to 65.2% from 64.9% in March. This is the percentage of the working age population in the labor force. This is still well below the 66% to 67% rate that was normal over the last 20 years. As people return to the labor force, as the employment picture improves, this will put upward pressure on the unemployment rate - even with job growth.
Part Time for Economic Reasons  From the BLS report:
The number of persons employed part time for economic reasons (sometimes referred to as involuntary part-time workers) was about unchanged at 9.2 million in April. These individuals were working part time because their hours had been cut back or because they were unable to find a full-time job.The number of workers only able to find part time jobs (or have had their hours cut for economic reasons) was at 9.152 million in April.
The all time record of 9.24 million was set in October.
These workers are included in the alternate measure of labor underutilization (U-6) that was at 17.1% in April.
Unemployed over 26 Weeks
 The blue line is the number of workers unemployed for 27 weeks or more. The red line is the same data as a percent of the civilian workforce.
According to the BLS, there are a record 6.72 million workers who have been unemployed for more than 26 weeks (and still want a job). This is a record 4.34% of the civilian workforce. (note: records started in 1948)
Although the headline number of 290,000 payroll jobs was a positive (this is 224,000 after adjusting for the 66,000 Census 2010 temporary hires), the underlying details were mixed. The positives: the employment-population ratio increased (after plunging sharply), and average hours increased.
Negatives include the unemployment rate increasing to 9.9%, a near record number of part time workers (for economic reasons) pushing U-6 to 17.1%, and a record number of workers unemployed for more than 26 weeks.
The number of long term unemployed is one of the key stories of this recession, especially since many of them are now losing their unemployment benefits. Note: In Q1, all of the increase in income - and much of the increase in consumption - came from government transfer payments for unemployment benefits.
I'll have even more later ...
Earlier employment post today:
April Employment Report: 290K Jobs Added, 9.9% Unemployment Rate
by Calculated Risk on 5/07/2010 08:30:00 AM
From the BLS:
Nonfarm payroll employment rose by 290,000 in April, the unemployment rate edged up to 9.9 percent, and the labor force increased sharply, the U.S. Bureau of Labor Statistics reported today.
 Click on graph for larger image.
This graph shows the unemployment rate and the year over year change in employment vs. recessions.
Nonfarm payrolls increased by 290,000 in April. The economy has lost 1.4 million jobs over the last year, and 7.8 million jobs since the recession started in December 2007.
The unemployment rate increased to 9.9 percent as people returned to the workforce.
 The second graph shows the job losses from the start of the employment recession, in percentage terms (as opposed to the number of jobs lost).
For the current recession, employment peaked in December 2007, and this recession is by far the worst recession since WWII in percentage terms, and 2nd worst in terms of the unemployment rate (only early '80s recession with a peak of 10.8 percent was worse).
Census 2010 hiring was 66,000 (NSA) in April.
This was well above expectations, especially given the level of Census 2010 hiring. The increase in the unemployment rate was because of people returning to the work force - the decline in the participation rate during the recession was stunning, and it is no surprise that people are once again looking for work. I'll have much more soon ...
Thursday, May 06, 2010
Employment Report Preview
by Calculated Risk on 5/06/2010 11:59:00 PM
The BLS will release the April Employment situation report tomorrow (Friday) morning at 8:30 AM ET. The consensus is around 200K payroll jobs and the unemployment rate declining slightly to 9.6%.
The estimates for temporary Census 2010 hiring are around 100K, so the market expectation is for about 100K payroll jobs ex-Census. That is the key number (the underlying job creation). Note: the largest increase in Census 2010 hiring will happen in May - perhaps 500K payroll jobs - and then all of those jobs will be unwound over the next 6 months.
The earlier data this week has been somewhat mixed. ADP reported 32K private sector jobs in April, the largest monthly increase since January 2008.
The ISM manufacturing report suggested fairly robust hiring in the manufacturing sector:
ISM's Employment Index registered 58.5 percent in April, which is 3.4 percentage points higher than the 55.1 percent reported in March. This is the fifth consecutive month of growth in manufacturing employment.Of course the manufacturing sector is relatively small.
And the ISM non-manufacturing report suggested job losses in the much larger service sector:
Employment activity in the non-manufacturing sector contracted in April for the 28th consecutive month. ISM's Non-Manufacturing Employment Index for April registered 49.5 percent. This reflects a decrease of 0.3 percentage point when compared to the 49.8 percent registered in March.The weekly initial unemployment claims was elevated throughout April suggesting continuing weakness in employment, but the Monster employment index was strong.
The Monster Employment Index rose eight points in April as a number of industries initiated springtime recruitment efforts. The annual growth rate further accelerated, rising by 11 percent, the highest rate of increase since July 2007.Anything above 100K ex-Census will be viewed as a solid report. As far as the unemployment rate, it usually drops 0.1% to 0.2% during the peak of the Census hiring (April and May) - however the participation rate fell so far during the recession, it is possible that the unemployment rate will tick up as more people reenter the workforce. We will know in a few hours ...
Weekly Initial Unemployment Claims decline slightly
by Calculated Risk on 5/06/2010 08:30:00 AM
The DOL reports on weekly unemployment insurance claims:
In the week ending May 1, the advance figure for seasonally adjusted initial claims was 444,000, a decrease of 7,000 from the previous week's revised figure of 451,000. The 4-week moving average was 458,500, a decrease of 4,750 from the previous week's revised average of 463,250.
...
The advance number for seasonally adjusted insured unemployment during the week ending April 24 was 4,594,000, a decrease of 59,000 from the preceding week's revised level of 4,653,000.
 Click on graph for larger image in new window.
This graph shows the 4-week moving average of weekly claims since 1971.
The four-week average of weekly unemployment claims decreased this week by 4,750 to 458,500.
The dashed line on the graph is the current 4-week average. The current level of 444,000 (and 4-week average of 458,500) is still high, and suggests continuing weakness in the labor market.
Although declining over the last few weeks, the 4-week average first declined to this level in December 2009, and has been at this level for about five months.
Wednesday, May 05, 2010
ADP: Private Employment increased in April
by Calculated Risk on 5/05/2010 08:15:00 AM
ADP reports:
Nonfarm private employment increased 32,000 from March to April 2010 on a seasonally adjusted basis, according to the ADP National Employment Report. The estimated change in employment from February to March 2010 was revised up, from a decline of 23,000 to an increase of 19,000.Note: ADP is private nonfarm employment only (no government jobs).
In addition, the revised estimate of the monthly change in employment from January to February 2010 shows a modest increase of 3,000. Thus, employment has increased for three straight months, albeit only modestly. The slow pace of improvement from February through April is consistent with the pause in the decline of initial unemployment claims that occurred during the winter months.
...
April’s ADP Report estimates nonfarm private employment in the service-providing sector rose by 50,000, the third consecutive monthly increase. Employment in the goods-producing sector declined 18,000 during April. However, while construction employment dropped 49,000, manufacturing employment, in an encouraging sign, rose 29,000, the third consecutive monthly increase.
This is close to the consensus forecast of an increase of 28,000 private sector jobs in April.
The BLS reports on Friday, and the consensus is for an increase of 200,000 payroll jobs in April, on a seasonally adjusted (SA) basis, with about 100,000 temporary Census 2010 jobs.
Thursday, April 29, 2010
Unemployment: Many Workers exhausting all benefits
by Calculated Risk on 4/29/2010 03:23:00 PM
From Bloomberg: More Than a Million in U.S. May Lose Jobless Benefits (ht Chris)
[Lawmakers] are quietly drawing the line at 99 weeks of aid, a mark that hundreds of thousands of Americans have already reached. In coming months, the number of those who will receive their final government check is projected to top 1 million.According to the BLS, a record 6.5 million workers have been unemployed for 27 weeks or more. The article notes a study by the Pew Fiscal Analysis Initiative that shows 3.4 million workers have been unemployed for more than a year.
...
Interviews with state officials found that in New York, 57,000 people have received their last check. In Florida, 130,000 are no longer eligible as are about 30,000 Ohioans.
Not all states have 99 weeks of benefits, but some workers are starting to exhaust all of their benefits.
The job market better pickup soon ...
Weekly Initial Unemployment Claims at 448,000
by Calculated Risk on 4/29/2010 08:30:00 AM
The DOL reports on weekly unemployment insurance claims:
In the week ending April 24, the advance figure for seasonally adjusted initial claims was 448,000, a decrease of 11,000 from the previous week's revised figure of 459,000. The 4-week moving average was 462,500, an increase of 1,500 from the previous week's revised average of 461,000.
...
The advance number for seasonally adjusted insured unemployment during the week ending April 17 was 4,645,000, a decrease of 18,000 from the preceding week's revised level of 4,663,000.
 Click on graph for larger image in new window.
This graph shows the 4-week moving average of weekly claims since 1971.
The four-week average of weekly unemployment claims increased this week by 1,500 to 462,500.
The dashed line on the graph is the current 4-week average. The current level of 448,000 (and 4-week average of 462,500) is still high, and suggests continuing weakness in the labor market.
The 4-week average first declined to this level in December 2009, and has essentially moved sideways for four months.


