 RSS Feed
 by Calculated Risk on 4/30/2024 07:03:00 PM
Tuesday, April 30, 2024
Wednesday: FOMC Announcement, ADP Employment, Construction Spending, Job Openings, ISM Mfg, Vehicle Sales
 Note: Mortgage rates are from MortgageNewsDaily.com and are for top tier scenarios.
Wednesday:
• At 7:00 AM ET, The Mortgage Bankers Association (MBA) will release the results for the mortgage purchase applications index.
• At 8:15 AM, The ADP Employment Report for April. This report is for private payrolls only (no government). The consensus is for 180,000 payroll jobs added in April, down from 184,000 added in March.
• At 10:00 AM, ISM Manufacturing Index for April. The consensus is for the ISM to be at 50.1, down from 50.3 in March.
• Also at 10:00 AM, Construction Spending for March. The consensus is for a 0.3% increase in construction spending.
• Also at 10:00 AM, Job Openings and Labor Turnover Survey for March from the BLS.
• At 2:00 PM, FOMC Meeting Announcement. No change to to the Fed funds rate is expected.at this meeting.
• At 2:30 PM, Fed Chair Jerome Powell holds a press briefing following the FOMC announcement.
• All day, Light vehicle sales for April. The expectation is for light vehicle sales to be 15.7 million SAAR in April, up from 15.5 million in March (Seasonally Adjusted Annual Rate).
HVS: Q1 2024 Homeownership and Vacancy Rates
by Calculated Risk on 4/30/2024 01:00:00 PM
The Census Bureau released the Residential Vacancies and Homeownership report for Q1 2024 today.
The results of this survey were significantly distorted by the pandemic in 2020.
This report is frequently mentioned by analysts and the media to track household formation, the homeownership rate, and the homeowner and rental vacancy rates. However, there are serious questions about the accuracy of this survey.
This survey might show the trend, but I wouldn't rely on the absolute numbers. Analysts probably shouldn't use the HVS to estimate the excess vacant supply or household formation, or rely on the homeownership rate, except as a guide to the trend.
National vacancy rates in the first quarter 2024 were 6.6 percent for rental housing and 0.8 percent for homeowner housing. The rental vacancy rate was not statistically different from the rate in the first quarter 2023 (6.4 percent) and virtually the same as the rate in the fourth quarter 2023 (6.6 percent).
The homeowner vacancy rate of 0.8 percent was virtually the same as the rate in the first quarter 2023 (0.8 percent) and not statistically different from the rate in the fourth quarter 2023 (0.9 percent).
The homeownership rate of 65.6 percent was not statistically different from the rate in the first quarter 2023 (66.0 percent) and not statistically different from the rate in the fourth quarter 2023 (65.7 percent).
emphasis added
 Click on graph for larger image.
The Red dots are the decennial Census homeownership rates for April 1st, 1990, 2000, 2010, and 2020.
The HVS homeownership rate decreased to 65.6% in Q1, from 65.7% in Q4.
The HVS homeownership rate decreased to 65.6% in Q1, from 65.7% in Q4.
The results in Q2 and Q3 2020 were distorted by the pandemic and should be ignored.
 The HVS homeowner vacancy decreased to 0.8% in Q1 from 0.9% in Q4.
 Once again - this probably shows the general trend, but I wouldn't rely on the absolute numbers.
The homeowner vacancy rate declined sharply during the pandemic and includes homes that are vacant and for sale (so this mirrors the low levels of existing home inventory).
 The rental vacancy rate was unchanged at 6.6% in Q1 from 6.6% in Q4. This is up from the low of 5.6% in 2021 and 2022.
The quarterly HVS is the timeliest survey on households, but there are many questions about the accuracy of this survey.
Comments on February House Prices, FHFA: House Prices Up 7.0% YoY
by Calculated Risk on 4/30/2024 09:48:00 AM
Today, in the Calculated Risk Real Estate Newsletter: Case-Shiller: National House Price Index Up 6.4% year-over-year in February; FHFA: House Prices Increased in February, up 7.0% YoY
Excerpt:
S&P/Case-Shiller released the monthly Home Price Indices for February ("February" is a 3-month average of December, January and February closing prices). January closing prices include some contracts signed in October, so there is a significant lag to this data. Here is a graph of the month-over-month (MoM) change in the Case-Shiller National Index Seasonally Adjusted (SA).
The MoM increase in the seasonally adjusted (SA) Case-Shiller National Index was at 0.41%. This was the thirteen consecutive MoM increase, and a larger MoM increase than the previous three months.
On a seasonally adjusted basis, prices increased month-to-month in 19 of the 20 Case-Shiller cities. Only Tampa saw a month-over-month decrease in February. Seasonally adjusted, San Francisco has fallen 8.2% from the recent peak, Seattle is down 6.1% from the peak, Portland down 4.0%, and Phoenix is down 3.1%.

There is much more in the article.
Case-Shiller: National House Price Index Up 6.4% year-over-year in February
by Calculated Risk on 4/30/2024 09:00:00 AM
S&P/Case-Shiller released the monthly Home Price Indices for February ("February" is a 3-month average of December, January and February closing prices).
This release includes prices for 20 individual cities, two composite indices (for 10 cities and 20 cities) and the monthly National index.
From S&P S&P CoreLogic Case-Shiller Index’s Upward Trend Persists in February 2024
The S&P CoreLogic Case-Shiller U.S. National Home Price NSA Index, covering all nine U.S. census divisions, reported a 6.4% annual gain in February, up from a 6.0% rise in the previous month. The 10- City Composite showed an increase of 8.0%, up from a 7.4% increase in the previous month. The 20- City Composite posted a year-over-year increase of 7.3%, up from a 6.6% increase in the previous month. San Diego continued to report the highest year-over-year gain among the 20 cities with an 11.4% increase in February, followed by Chicago and Detroit , with an increase of 8.9%. Portland, though still holding the lowest rank after reporting two consecutive months of the smallest year-over-year growth, had a significant increase in annual gain of 2.2% in February.
...
The U.S. National Index, the 20-City Composite, and the 10-City Composite, for the first time since November 2023, showed a pre-seasonality adjustment increase of 0.6%, 0.9% and 1.0% respectively.
After seasonal adjustment, the U.S. National Index posted a month-over-month increase of 0.4%, while the 20-City and the 10-City Composite both reported month-over-month increases of 0.6%.
“U.S. home prices continued their drive higher,” says Brian D. Luke, Head of Commodities, Real & Digital Assets at S&P Dow Jones Indices. “Our National Composite rose by 6% in January, the fastest annual rate since 2022. Stronger gains came from our 10- and 20-City Composite indices, rising 7.4% and 6.6%, respectively. For the second consecutive month, all cities reported increases in annual prices, with San Diego surging 11.2%. On a seasonal adjusted basis, home prices have continued to break through previous all-time highs set last year”
emphasis added
 Click on graph for larger image.
 The first graph shows the nominal seasonally adjusted Composite 10, Composite 20 and National indices (the Composite 20 was started in January 2000).
The Composite 10 index was up 0.6% in February (SA). The Composite 20 index was up 0.6% (SA) in February.
The National index was up 0.4% (SA) in February.
 The second graph shows the year-over-year change in all three indices.
The Composite 10 SA was up 8.0% year-over-year. The Composite 20 SA was up 7.3% year-over-year.
The National index SA was up 6.4% year-over-year.
Annual price changes were above expectations. I'll have more later.
Monday, April 29, 2024
Tuesday: Case-Shiller House Prices
by Calculated Risk on 4/29/2024 08:06:00 PM
 From Matthew Graham at Mortgage News Daily: Mortgage Rates Sideways to Slightly Lower to Start New Week
Mortgage rates didn't change much at all over the weekend with the average lender still in the highest territory since November. The average conventional 30yr fixed rate is just under 7.5% for top tier scenarios.Tuesday:
Things could end up changing quite a bit by the end of this week owing to a slew of important events and economic reports. [30 year fixed 7.43%]
emphasis added
• At 9:00 AM ET, S&P/Case-Shiller House Price Index for February. The consensus is for a 6.7% year-over-year increase in the Comp 20 index for February.
• Also at 9:00 AM, FHFA House Price Index for February. This was originally a GSE only repeat sales, however there is also an expanded index.
• At 9:45 AM, Chicago Purchasing Managers Index for April. The consensus is for a reading of 45.0, up from 41.4 in March.
• At 10:00 AM, the Q1 2024 Housing Vacancies and Homeownership from the Census Bureau.
Q1 2024 GDP Details on Residential and Commercial Real Estate
by Calculated Risk on 4/29/2024 03:02:00 PM
The BEA released the underlying details for the Q1 advance GDP report on Friday.
The BEA reported that investment in non-residential structures decreased at a 0.1% annual pace in Q1.
 Click on graph for larger image.
The first graph shows investment in offices, malls and lodging as a percent of GDP.
Investment in offices (blue) increased slightly in Q1 and was up 4.1% year-over-year. And declined slightly as a percent of GDP.
Investment in multimerchandise shopping structures (malls) peaked in 2007 and was down about 1% year-over-year in Q1. The vacancy rate for malls is still very high, so investment will probably stay low for some time.
Lodging investment decreased in Q1 compared to Q4, and lodging investment was up 1% year-over-year.
All three sectors - offices, malls, and hotels - were hurt significantly by the pandemic. And the office vacancy rate is at a record high, and this will hold down office investment.
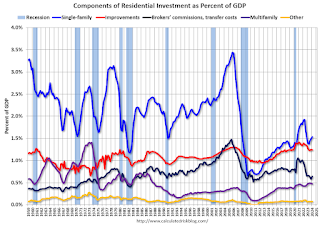 The second graph is for Residential investment components as a percent of GDP. According to the Bureau of Economic Analysis, RI includes new single-family structures, multifamily structures, home improvement, Brokers’ commissions and other ownership transfer costs, and a few minor categories (dormitories, manufactured homes).
Investment in single family structures was up to $433 billion (SAAR) (about 1.5% of GDP) and was up 16% year-over-year.
Investment in multi-family structures was down in Q1 compared to Q4 to $133 billion (SAAR), but still up 12% YoY.
Investment in home improvement was at a $351 billion (SAAR) in Q1 (about 1.2% of GDP). Home improvement spending was strong during the pandemic but has declined as a percent of GDP recently.
Note that Brokers' commissions (black) increased sharply as existing home sales increased in the second half of 2020 but declined when mortgage rates increased. Brokers' commissions were up 3% year-over-year in Q1.
Hotels: Occupancy Rate decreased 0.3% Year-over-year
by Calculated Risk on 4/29/2024 01:11:00 PM
U.S. hotel performance showed mixed results from the previous week, according to CoStar’s latest data through 20 April. ...The following graph shows the seasonal pattern for the hotel occupancy rate using the four-week average.
14-20 April 2024 (percentage change from comparable week in 2023):
• Occupancy: 66.8% (-0.3%)
• Average daily rate (ADR): US$158.60 (+1.5%)
• Revenue per available room (RevPAR): US$105.94 (+1.2%)
emphasis added
 Click on graph for larger image.
The red line is for 2024, black is 2020, blue is the median, and dashed light blue is for 2023. Dashed purple is for 2018, the record year for hotel occupancy.
The 4-week average of the occupancy rate is tracking last year, and slightly above the median rate for the period 2000 through 2023 (Blue).
Note: Y-axis doesn't start at zero to better show the seasonal change.
The 4-week average of the occupancy rate will move mostly sideways seasonally until the summer travel season.
Energy expenditures as a percentage of PCE
by Calculated Risk on 4/29/2024 11:01:00 AM
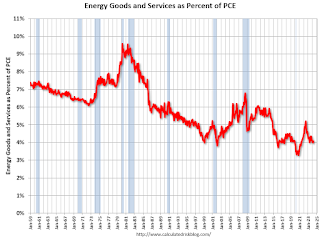
During the early stages of the pandemic, energy expenditures as a percentage of PCE hit an all-time low of 3.3% of PCE. Then energy expenditures increased to 2018 levels by the end of 2021.
With the invasion of Ukraine, energy expenditures as a percentage of PCE increased further in 2022.
Here is an update through the March 2024 PCE report.
This graph shows expenditures on energy goods and services as a percent of total personal consumption expenditures. This is one of the measures that Professor Hamilton at Econbrowser looks at to evaluate any drag on GDP from energy prices.
Click on graph for larger image.
Data source: BEA.
In general, energy expenditures as a percent of PCE has been trending down for decades. The huge spikes in energy prices during the oil crisis of 1973 and 1979 are obvious. As is the increase in energy prices during the 2001 through 2008 period.
This graph shows expenditures on energy goods and services as a percent of total personal consumption expenditures. This is one of the measures that Professor Hamilton at Econbrowser looks at to evaluate any drag on GDP from energy prices.

Click on graph for larger image.
Data source: BEA.
In general, energy expenditures as a percent of PCE has been trending down for decades. The huge spikes in energy prices during the oil crisis of 1973 and 1979 are obvious. As is the increase in energy prices during the 2001 through 2008 period.
In August March 2024, energy expenditures as a percentage of PCE were at 4.1% of PCE, up from 4.0% in February, and down from the recent peak of 5.2% in June 2022.
This is close to the pre-pandemic level of PCE.
Housing April 29th Weekly Update: Inventory up 2.5% Week-over-week, Up 31.8% Year-over-year
by Calculated Risk on 4/29/2024 08:12:00 AM
Altos reports that active single-family inventory was up 2.5% week-over-week. Inventory bottomed in mid-February this year, as opposed to mid-April in 2023, and inventory is now up 12.6% from the February bottom.
 Click on graph for larger image.
This inventory graph is courtesy of Altos Research.
As of April 26th, inventory was at 556 thousand (7-day average), compared to 543 thousand the prior week.
Inventory is still far below pre-pandemic levels.

The red line is for 2024. The black line is for 2019. Note that inventory is up almost double from the record low for the same week in 2022, but still well below normal levels.
Inventory was up 31.8% compared to the same week in 2023 (last week it was up 30.9%), and down 35.9% compared to the same week in 2019 (last week it was down 37.2%).
Back in June 2023, inventory was down almost 54% compared to 2019, so the gap to more normal inventory levels is slowly closing.
Mike Simonsen discusses this data regularly on Youtube.
Sunday, April 28, 2024
Sunday Night Futures
by Calculated Risk on 4/28/2024 06:16:00 PM
Weekend:
• Schedule for Week of April 28, 2024
Monday:
• At 10:30 AM ET, Dallas Fed Survey of Manufacturing Activity for April.
From CNBC: Pre-Market Data and Bloomberg futures S&P 500 are up 4 and DOW futures are up 60 (fair value).
Oil prices were up over the last week with WTI futures at $83.85 per barrel and Brent at $89.50 per barrel. A year ago, WTI was at $77, and Brent was at $81 - so WTI oil prices are up about 8% year-over-year.
Here is a graph from Gasbuddy.com for nationwide gasoline prices. Nationally prices are at $3.64 per gallon. A year ago, prices were at $3.59 per gallon, so gasoline prices are up $0.05 year-over-year.
Realtor.com Reports Active Inventory Up 31.7% YoY; New Listings Up 13.5% YoY
by Calculated Risk on 4/28/2024 12:39:00 PM
What this means: On a weekly basis, Realtor.com reports the year-over-year change in active inventory and new listings. On a monthly basis, they report total inventory. For March, Realtor.com reported inventory was up 23.5% YoY, but still down almost 38% compared to March 2017 to 2019 levels.
Now - on a weekly basis - inventory is up 31.7% YoY.
Realtor.com has monthly and weekly data on the existing home market. Here is their weekly report: Weekly Housing Trends View—Data Week Ending April 20, 2024 Here is a graph of the year-over-year change in inventory according to realtor.com.
Inventory was up year-over-year for the 24th consecutive week.
Realtor.com has monthly and weekly data on the existing home market. Here is their weekly report: Weekly Housing Trends View—Data Week Ending April 20, 2024
• Active inventory increased, with for-sale homes 31.7% above year-ago levels.
For the 24th straight week, there were more homes listed for sale versus the prior year, giving homebuyers more options. As mortgage rates have climbed to new 2024 highs, we could see sellers adjust their plans, since nearly three-quarters of potential sellers also play to buy a home. However, the long build-up to listing–80% have been thinking about selling for 1 to 3 years–could mean that this year’s sellers are less-deterred by market fluctuations.
• New listings–a measure of sellers putting homes up for sale–were up this week, by 13.5% from one year ago.
Since February, the number of homes newly listed for sale has surpassed year ago pace by double-digit with the exception of a few weeks around this year’s spring holidays. As reported in the Realtor.com March housing report, newly listed homes trailed behind every prior year except 2023’s record low.
 Here is a graph of the year-over-year change in inventory according to realtor.com.
 Inventory was up year-over-year for the 24th consecutive week.
However, inventory is still historically very low.
New listings remain below typical pre-pandemic levels although increasing.
FOMC Preview: No Change to Fed Funds Rate
by Calculated Risk on 4/28/2024 08:21:00 AM
Most analysts expect there will be no change to the federal funds rate at the meeting this week keeping the target range at 5‑1/4 to 5-1/2 percent. Fed Chair Powell is expected to maintain a slightly hawkish stance during the press conference, since the recent inflation reports were above expectations.
Currently market participants expect the next Fed move to be a 25 bp cut announced at the September FOMC meeting. The market is almost pricing in a 2nd cut in December.
From BofA:
The Fed is less confident about how quickly inflation will slow, but it has not given up on its expectation that it will. We expect the Fed to say it is prepared to keep policy rates where they are for as long as needed to bring inflation down. We also look for the Fed to announce the tapering of balance sheet runoff by cutting the maximum runoff cap on Treasuries in half.
Projections will NOT be released at this meeting. For review, here are the March projections. Since the last projections were released, growth has been slightly slower, and inflation slightly higher than expected.
The BEA's advance report for Q1 GDP showed real growth at 1.6% annualized. Early estimates for Q2 GDP are around 3% annualized, and the FOMC projections for year-over-year growth in Q4 2024 are close.
| GDP projections of Federal Reserve Governors and Reserve Bank presidents, Change in Real GDP1 | ||||
|---|---|---|---|---|
| Projection Date | 2024 | 2025 | 2026 | |
| Mar 2024 | 2.0 to 2.4 | 1.9 to 2.3 | 1.8 to 2.1 | |
| Dec 2023 | 1.2 to 1.7 | 1.5 to 2.0 | 1.8 to 2.0 | |
The unemployment rate was at 3.8% in March, just below the FOMC projections for Q4.
| Unemployment projections of Federal Reserve Governors and Reserve Bank presidents, Unemployment Rate2 | ||||
|---|---|---|---|---|
| Projection Date | 2024 | 2025 | 2026 | |
| Mar 2024 | 3.9 to 4.1 | 3.9 to 4.2 | 3.9 to 4.3 | |
| Dec 2023 | 4.0 to 4.2 | 4.0 to 4.2 | 3.9 to 4.3 | |
As of March 2024, PCE inflation increased 2.7 percent year-over-year (YoY). This is at the high end of the FOMC projections for Q4.
| Inflation projections of Federal Reserve Governors and Reserve Bank presidents, PCE Inflation1 | ||||
|---|---|---|---|---|
| Projection Date | 2024 | 2025 | 2026 | |
| Mar 2024 | 2.3 to 2.7 | 2.1 to 2.2 | 2.0 to 2.1 | |
| Dec 2023 | 2.2 to 2.5 | 2.0 to 2.2 | 2.0 | |
PCE core inflation increased 2.8 percent YoY in March. This is also at the high end of the FOMC projections for Q4 2024.
Over the last 6 months, the PCE Price Index increase 2.5% annualized, the core PCE price index increased at a 3.0% annual rate. However, core PCE minus Housing increased at a 2.4% annualized rate suggesting that 2024 projections are a little high.
| Core Inflation projections of Federal Reserve Governors and Reserve Bank presidents, Core Inflation1 | ||||
|---|---|---|---|---|
| Projection Date | 2024 | 2025 | 2026 | |
| Mar 2024 | 2.5 to 2.8 | 2.1 to 2.3 | 2.0 to 2.1 | |
| Dec 2023 | 2.4 to 2.7 | 2.0 to 2.2 | 2.0 to 2.1 | |
Saturday, April 27, 2024
Real Estate Newsletter Articles this Week: New Home Sales Increase to 693,000 Annual Rate in March
by Calculated Risk on 4/27/2024 02:11:00 PM
At the Calculated Risk Real Estate Newsletter this week:
• New Home Sales Increase to 693,000 Annual Rate in March
• Lawler: Observations on the Recent Surge in Net International Migration
• Fannie and Freddie: Single Family Serious Delinquency Rate Decreased, Multi-family Decreased in March
• Final Look at Local Housing Markets in March
This is usually published 4 to 6 times a week and provides more in-depth analysis of the housing market.
Schedule for Week of April 28, 2024
by Calculated Risk on 4/27/2024 08:11:00 AM
The key report scheduled for this week is the April employment report.
Other key reports include February Case-Shiller house prices, April vehicle sales, and the March trade balance.
The FOMC meets this week and no change to the Fed funds rate is expected.
For manufacturing, the April Dallas Fed manufacturing survey, and the ISM index will be released.
10:30 AM: Dallas Fed Survey of Manufacturing Activity for April.
 9:00 AM: S&P/Case-Shiller House Price Index for February.
This graph shows the nominal seasonally adjusted National Index, Composite 10 and Composite 20 indexes through the most recent report (the Composite 20 was started in January 2000).
The consensus is for a 6.7% year-over-year increase in the Comp 20 index for February.
9:00 AM: FHFA House Price Index for February. This was originally a GSE only repeat sales, however there is also an expanded index.
9:45 AM: Chicago Purchasing Managers Index for April. The consensus is for a reading of 45.0, up from 41.4 in March.
10:00 AM: the Q1 2024 Housing Vacancies and Homeownership from the Census Bureau.
7:00 AM ET: The Mortgage Bankers Association (MBA) will release the results for the mortgage purchase applications index.
8:15 AM: The ADP Employment Report for April. This report is for private payrolls only (no government). The consensus is for 180,000 payroll jobs added in April, down from 184,000 added in March.
10:00 AM ET: ISM Manufacturing Index for April. The consensus is for the ISM to be at 50.1, down from 50.3 in March.
10:00 AM: Construction Spending for March. The consensus is for a 0.3% increase in construction spending.
 10:00 AM ET: Job Openings and Labor Turnover Survey for March from the BLS.
 This graph shows job openings (black line), hires (dark blue), Layoff, Discharges and other (red column), and Quits (light blue column) from the JOLTS.
Jobs openings were little changed in February at 8.76 million from 8.75 million in January.
The number of job openings (black) were down 11% year-over-year in February.
2:00 PM: FOMC Meeting Announcement. No change to to the Fed funds rate is expected.at this meeting.
2:30 PM: Fed Chair Jerome Powell holds a press briefing following the FOMC announcement.
 All day: Light vehicle sales for April. The expectation is for light vehicle sales to be 15.7 million SAAR in April, up from 15.5 million in March (Seasonally Adjusted Annual Rate).
This graph shows light vehicle sales since the BEA started keeping data in 1967. The dashed line is the sales rate for the previous month.
8:30 AM: The initial weekly unemployment claims report will be released. The consensus is for 210 thousand initial claims, up from 207 thousand last week.
 8:30 AM: Trade Balance report for March from the Census Bureau.
 This graph shows the U.S. trade deficit, with and without petroleum, through the most recent report. The blue line is the total deficit, and the black line is the petroleum deficit, and the red line is the trade deficit ex-petroleum products.
The consensus is the trade deficit to be $68.8 billion. The U.S. trade deficit was at $68.9 billion in February.
 8:30 AM: Employment Report for April. The consensus is for 210,000 jobs added, and for the unemployment rate to be unchanged at 3.8%.
There were 303,000 jobs added in March, and the unemployment rate was at 3.8%.
This graph shows the jobs added per month since January 2021.
10:00 AM: the ISM Services Index for April. The consensus is for a reading of 52.0, up from 51.4.
Friday, April 26, 2024
April 26th COVID Update: Hospitalizations at Pandemic Low!
by Calculated Risk on 4/26/2024 07:12:00 PM
 Note: Mortgage rates are from MortgageNewsDaily.com and are for top tier scenarios.
It is likely that we will see pandemic lows for weekly deaths in the next several weeks. That is welcome news!
For deaths, I'm currently using 4 weeks ago for "now", since the most recent three weeks will be revised significantly.
Hospitalizations have declined significantly from the winter high of 30,027 are now below the low of 5,386 last year.
| COVID Metrics | ||||
|---|---|---|---|---|
| Now | Week Ago | Goal | ||
| Hospitalized2 | 5,195 | 6,055 | ≤3,0001 | |
| Deaths per Week2 | 648 | 806 | ≤3501 | |
| 1my goals to stop weekly posts, 2Weekly for Currently Hospitalized, and Deaths 🚩 Increasing number weekly for Hospitalized and Deaths ✅ Goal met. | ||||
 Click on graph for larger image.
This graph shows the weekly (columns) number of deaths reported.
Weekly deaths have declined sharply from the recent peak of 2,561 but are still 30% above the pandemic low of 491 last July.
 This appears to be a leading indicator for COVID hospitalizations and deaths.
Nationally, COVID in wastewater is now off 90% from the holiday peak at the end of December, and that suggests weekly hospitalizations and deaths will continue to decline.
Las Vegas March 2024: Visitor Traffic Up 0.4% YoY; Convention Traffic Down 37%
by Calculated Risk on 4/26/2024 03:53:00 PM
From the Las Vegas Visitor Authority: March 2024 Las Vegas Visitor Statistics
Benefitting from a mix of headliners and events from NASCAR to Madonna to several college basketball tournaments, Las Vegas visitation neared 3.7M in March 2024, up +0.4% YoY and nearly matching Mar 2019.
With a tough comparison to record‐breaking convention attendance last March when the destination hosted the triennial CONEXPO‐CON/AGG tradeshow (142,000), convention attendance this March saw a ‐37.2% YoY decrease.
Overall hotel occupancy reached 85.3% for the month (‐3.0 pts YoY). After breaking the record for both ADR and RevPAR last March, ADR and RevPAR saw a decrease of ‐16.4% and ‐19.2% respectively.
emphasis added
 Click on graph for larger image.
 The first graph shows visitor traffic for 2019 (Black), 2020 (dark blue), 2021 (light blue), 2022 (light orange), 2023 (dark orange) and 2024 (red).
Visitor traffic was up 0.4% compared to last March. Visitor traffic was down 0.7% compared to the same month in 2019.
The second graph shows convention traffic.

Convention traffic was down 37.2% compared to March 2023, and down 12.3% compared to March 2019. 
Note: There was almost no convention traffic from April 2020 through May 2021.
Fannie and Freddie: Single Family Serious Delinquency Rate Decreased, Multi-family Decreased in March
by Calculated Risk on 4/26/2024 12:53:00 PM
Today, in the Calculated Risk Real Estate Newsletter: Fannie and Freddie: Single Family Serious Delinquency Rate Decreased, Multi-family Decreased in March
Brief excerpt:
Single-family serious delinquencies decreased in March, and multi-family serious delinquencies decreased again after the huge surge in January.
...
Freddie Mac reports that the multi-family delinquencies rate declined to 0.34% in March, down from 0.35% in February, and down from 0.44% in January.
This graph shows the Freddie multi-family serious delinquency rate since 2012. Rates were still high in 2012 following the housing bust and financial crisis.
The multi-family rate increased following the pandemic and has increased recently as rent growth has slowed, vacancy rates have increased, and borrowing rates have increased sharply. The rate surged higher in January but declined in February and March - but is still at a high level. This will be something to watch as more apartments come on the market.

There is much more in the article.
PCE Measure of Shelter Slows Slightly to 5.8% YoY in March
by Calculated Risk on 4/26/2024 08:57:00 AM
Here is a graph of the year-over-year change in shelter from the CPI report and housing from the PCE report this morning, both through March 2024.
 CPI Shelter was up 5.6% year-over-year in March, down from 5.8% in February, and down from the cycle peak of 8.2% in March 2023.
Housing (PCE) was up 5.8% YoY in March, down slightly from 5.8% in January, and down from the cycle peak of 8.3% in April 2023.
Since asking rents are mostly flat year-over-year, these measures will continue to slow over the next year.
Since asking rents are mostly flat year-over-year, these measures will continue to slow over the next year.
The second graph shows PCE prices, Core PCE prices and Core ex-housing over the last 6 months (annualized):
 Key measures are slightly above the Fed's target on a 6-month basis.
PCE Price Index: 2.5% (6 month annualized)
Core PCE Prices: 3.0%
Core minus Housing: 2.4%
Personal Income increased 0.5% in March; Spending increased 0.8%
by Calculated Risk on 4/26/2024 08:30:00 AM
The BEA released the Personal Income and Outlays report for March:
Personal income increased $122.0 billion (0.5 percent at a monthly rate) in March, according to estimates released today by the Bureau of Economic Analysis. Disposable personal income (DPI), personal income less personal current taxes, increased $104.0 billion (0.5 percent) and personal consumption expenditures (PCE) increased $160.9 billion (0.8 percent).The March PCE price index increased 2.7 percent year-over-year (YoY), up from 2.5 percent YoY in February, and down from the recent peak of 7.0 percent in June 2022.
The PCE price index increased 0.3 percent. Excluding food and energy, the PCE price index increased 0.3 percent. Real DPI increased 0.2 percent in March and real PCE increased 0.5 percent; goods increased 1.1 percent and services increased 0.2 percent.
emphasis added
The PCE price index, excluding food and energy, increased 2.8 percent YoY, unchanged from 2.8 percent in February, and down from the recent peak of 5.4 percent in February 2022.
The following graph shows real Personal Consumption Expenditures (PCE) through March 2024 (2017 dollars). Note that the y-axis doesn't start at zero to better show the change.
 Click on graph for larger image.
The dashed red lines are the quarterly levels for real PCE.
Personal income was at expectations, and PCE was well above expectations.
Inflation was slightly above expectations.
Thursday, April 25, 2024
Friday: Personal Income and Outlays
by Calculated Risk on 4/25/2024 08:01:00 PM
 Note: Mortgage rates are from MortgageNewsDaily.com and are for top tier scenarios.
Friday:
• At 8:30 AM ET, Personal Income and Outlays, March 2024. The consensus is for a 0.5% increase in personal income, and for a 0.3% increase in personal spending. And for the Core PCE price index to increase 0.3%. PCE prices are expected to be up 2.6% YoY, and core PCE prices up 2.7% YoY.
• At 10:00 AM: University of Michigan's Consumer sentiment index (Final for April). The consensus is for a reading of 77.9.
Lawler: Observations on the Recent Surge in Net International Migration
by Calculated Risk on 4/25/2024 02:33:00 PM
Today, in the Calculated Risk Real Estate Newsletter: Lawler: Observations on the Recent Surge in Net International Migration
A brief excerpt:
NOTE: Housing economist Tom Lawler has written extensively on demographics and the impact on household growth and housing demand. Last November, Lawler reviewed the most recent Census projections: Lawler on Existing Home Sales, Population Projections and Household Slowdown. Today he discusses the recent surge in Net International Migration.There is much more in the article.
From Tom Lawler:
One of the biggest demographic stories of the past two years has been the recent surge in net international migration (NIM). While this surge is not reflected in the latest Census Bureau’s “official” population estimates and one-year-ahead forecasts (so-called “Vintage 2023), that is because these estimates did not account for the rapid increase in “unauthorized” immigration over the past two years.
Estimates of NIM over the past few years vary considerably. For example, in its January 2024 demographic forecast update the CBO estimated that NIM was 3.267 million in 2023, up from 2.674 million in 2022 and 1.171 million in 2021. (These are calendar-year estimates). This contrasts markedly with Census’ Vintage 2023 NIM estimates of 1.139 million in the 12 months ending June 2023, 999 thousand in the 12 months ending June 2022, and 376 thousand in the 12 months ending June 2021.
Goldman Sachs, also incorporating data on unauthorized immigration, estimates that NIM in 2023 was 2.5 million, a bit below the CBO estimate but well above official Census estimates from the Population Division.
U.S. Births decreased in 2023
by Calculated Risk on 4/25/2024 01:01:00 PM
From the National Center for Health Statistics: Births: Provisional Data for 2023. The NCHS reports:
The provisional number of births for the United States in 2023 was 3,591,328, down 2% from 2022. The general fertility rate was 54.4 births per 1,000 females ages 15–44, down 3% from 2022. The total fertility rate was 1,616.5 births per 1,000 women in 2023, a decline of 2% from 2022. Birth rates declined for females in age groups 15–19 through 35–39 and were unchanged for females ages 10–14 and for women ages 40–44 and 45–49 in 2023. The birth rate for teenagers ages 15–19 declined by 3% in 2023 to 13.2 births per 1,000 females; the rate for younger teenagers (ages 15–17) was unchanged, and the rate for older teenagers (ages 18–19) declined 3%. THere is a long-term graph of annual U.S. births through 2023.
emphasis added
report.
 Click on graph for larger image.
Births peaked in 2007 and have generally declined since then.
Note the amazing decline in teenage births.
There is much more in the report.
NAR: Pending Home Sales Increase 3.4% in March; Up 0.1% Year-over-year
by Calculated Risk on 4/25/2024 10:00:00 AM
From the NAR: Pending Home Sales Ascended 3.4% in March
Pending home sales in March climbed 3.4%, according to the National Association of REALTORS®. The Northeast, South and West posted monthly gains in transactions while the Midwest recorded a loss. Year-over-year, the Northeast and South registered decreases but the Midwest and West improved.This was well above expectations. Note: Contract signings usually lead sales by about 45 to 60 days, so this would usually be for closed sales in April and May.
The Pending Home Sales Index (PHSI)* – a forward-looking indicator of home sales based on contract signings – increased to 78.2 in March. Year over year, pending transactions were up 0.1%. An index of 100 is equal to the level of contract activity in 2001.
...
The Northeast PHSI increased 2.7% from last month to 65.1, a decline of 0.3% from March 2023. The Midwest index fell 4.3% to 78.1 in March, up 1.3% from one year ago.
The South PHSI improved 7.0% to 95.8 in March, dropping 1.5% from the prior year. The West index rose 6.8% in March to 61.0, up 3.6% from March 2023.
emphasis added
BEA: Real GDP increased at 1.6% Annualized Rate in Q1
by Calculated Risk on 4/25/2024 08:38:00 AM
From the BEA: Gross Domestic Product, First Quarter 2024 (Advance Estimate)
Real gross domestic product (GDP) increased at an annual rate of 1.6 percent in the first quarter of 2024, according to the "advance" estimate released by the Bureau of Economic Analysis. In the fourth quarter of 2023, real GDP increased 3.4 percent.PCE increased at a 2.5% annual rate, and residential investment increased at a 13.9% rate. The advance Q1 GDP report, with 1.6% annualized increase, was well below expectations.
The increase in real GDP primarily reflected increases in consumer spending, residential fixed investment, nonresidential fixed investment, and state and local government spending that were partly offset by a decrease in private inventory investment. Imports, which are a subtraction in the calculation of GDP, increased.
The increase in consumer spending reflected an increase in services that was partly offset by a decrease in goods. Within services, the increase primarily reflected increases in health care as well as financial services and insurance. Within goods, the decrease primarily reflected decreases in motor vehicles and parts as well as gasoline and other energy goods. Within residential fixed investment, the increase was led by brokers’ commissions and other ownership transfer costs as well as new single-family housing construction. The increase in nonresidential fixed investment mainly reflected an increase in intellectual property products. The increase in state and local government spending reflected an increase in compensation of state and local government employees. The decrease in inventory investment primarily reflected decreases in wholesale trade and manufacturing. Within imports, the increase reflected increases in both goods and services.
Compared to the fourth quarter, the deceleration in real GDP in the first quarter primarily reflected decelerations in consumer spending, exports, and state and local government spending and a downturn in federal government spending. These movements were partly offset by an acceleration in residential fixed investment. Imports accelerated.
emphasis added
I'll have more later ...
Weekly Initial Unemployment Claims Decrease to 207,000
by Calculated Risk on 4/25/2024 08:30:00 AM
The DOL reported:
In the week ending April 20, the advance figure for seasonally adjusted initial claims was 207,000, a decrease of 5,000 from the previous week's unrevised level of 212,000. The 4-week moving average was 213,250, a decrease of 1,250 from the previous week's unrevised average of 214,500.The following graph shows the 4-week moving average of weekly claims since 1971.
emphasis added
 Click on graph for larger image.
The dashed line on the graph is the current 4-week average. The four-week average of weekly unemployment claims decreased to 213,250.
The previous week was unrevised.
Weekly claims were lower than the consensus forecast.
Wednesday, April 24, 2024
Thursday: Q1 GDP, Unemployment Claims, Pending Home Sales
by Calculated Risk on 4/24/2024 08:51:00 PM
 Note: Mortgage rates are from MortgageNewsDaily.com and are for top tier scenarios.
Thursday:
• At 8:30 AM ET, Gross Domestic Product, 1st quarter 2024 (Advance estimate). The consensus is that real GDP increased 2.1% annualized in Q1, down from 3.4% in Q4.
• Also at 8:30 AM, The initial weekly unemployment claims report will be released. The consensus is for 210 thousand initial claims, down from 212 thousand last week.
• At 10:00 AM: Pending Home Sales Index for March. The consensus is for a 2.0% decrease in the index.
• At 11:00 AM: the Kansas City Fed manufacturing survey for April.
April Vehicle Sales Forecast: 15.8 million SAAR, Up 1% YoY
by Calculated Risk on 4/24/2024 05:54:00 PM
From WardsAuto: April U.S. Light-Vehicle Sales to Start Second Quarter with Lukewarm Growth (pay content). Brief excerpt:
The second quarter will be key to 2024’s total results, as demand must continue growing during April-June for the entire year to top 16 million units for the first time in five years. The period could be a leading indicator of how much automakers ultimately are willing to lay off incentives and other forms of discounting, vs. implementing production slowdowns, to keep inventory in check if demand does not pick up significantly.
emphasis added
 Click on graph for larger image.
This graph shows actual sales from the BEA (Blue), and Wards forecast for April (Red).
On a seasonally adjusted annual rate basis, the Wards forecast of 15.8 million SAAR, would be up 2% from last month, and up 1% from a year ago.
Philly Fed: State Coincident Indexes Increased in 44 States in March (3-Month Basis)
by Calculated Risk on 4/24/2024 04:11:00 PM
From the Philly Fed:
The Federal Reserve Bank of Philadelphia has released the coincident indexes for the 50 states for March 2024. Over the past three months, the indexes increased in 44 states, decreased in five states, and remained stable in one, for a three-month diffusion index of 78. Additionally, in the past month, the indexes increased in 41 states, decreased in two states, and remained stable in seven, for a one-month diffusion index of 78. For comparison purposes, the Philadelphia Fed has also developed a similar coincident index for the entire United States. The Philadelphia Fed’s U.S. index increased 0.7 percent over the past three months and 0.3 percent in March.Note: These are coincident indexes constructed from state employment data. An explanation from the Philly Fed:
emphasis added
The coincident indexes combine four state-level indicators to summarize current economic conditions in a single statistic. The four state-level variables in each coincident index are nonfarm payroll employment, average hours worked in manufacturing by production workers, the unemployment rate, and wage and salary disbursements deflated by the consumer price index (U.S. city average). The trend for each state’s index is set to the trend of its gross domestic product (GDP), so long-term growth in the state’s index matches long-term growth in its GDP.
 Click on map for larger image.
Here is a map of the three-month change in the Philly Fed state coincident indicators. This map was all red during the worst of the Pandemic and also at the worst of the Great Recession.
The map is almost all positive on a three-month basis.
Source: Philly Fed.
 And here is a graph is of the number of states with one month increasing activity according to the Philly Fed.
 This graph includes states with minor increases (the Philly Fed lists as unchanged).
In March, 44 states had increasing activity including minor increases.
In March, 44 states had increasing activity including minor increases.
AIA: "Architecture firm billings retreat further in March"; Multi-family Billings Decline for 20th Consecutive Month
by Calculated Risk on 4/24/2024 01:16:00 PM
Note: This index is a leading indicator primarily for new Commercial Real Estate (CRE) investment.
From the AIA: ABI March 2024: Architecture firm billings retreat further in March
Business conditions at architecture firms softened in March, as the AIA/Deltek Architecture Billings Index (ABI) score declined to 43.6 for the month. This marked the 14th consecutive month of declining billings at firms as inflation, supply chain issues, and other economic challenges continue to affect business. While inquiries into new projects have continued to grow during that period, it has been at a slower pace than in 2021 and 2022. More notably, the value of new signed design contracts was flat in March, which has generally been the trend for the last year and a half. This shows that clients are interested in starting new projects but remain hesitant to sign a contract and officially commit to those projects. However, most firms report that they still have strong project backlogs of 6.6 months, on average, so even with the ongoing soft patch, they still have work in the pipeline.• Northeast (46.0); Midwest (45.2); South (45.3); West (47.6)
Architecture firm billings also continued to decline at firms in all regions of the country, and at firms of all specializations in March, just like in February. Regionally, business conditions were softest at firms located in the Midwest and South. By specialization, billings declined faster at firms with a commercial/industrial specialization and remained weak at firms with a multifamily residential specialization. However, firms with an institutional specialization reported billings that were essentially flat, marking the third straight month of that trend.
...
The ABI score is a leading economic indicator of construction activity, providing an approximately nine-to-twelve-month glimpse into the future of nonresidential construction spending activity. The score is derived from a monthly survey of architecture firms that measures the change in the number of services provided to clients.
emphasis added
• Sector index breakdown: commercial/industrial (42.9); institutional (49.9); multifamily residential (44.2)
 Click on graph for larger image.
This graph shows the Architecture Billings Index since 1996. The index was at 43.6 in March, down from 49.5 in February. Anything below 50 indicates a decrease in demand for architects' services.
Note: This includes commercial and industrial facilities like hotels and office buildings, multi-family residential, as well as schools, hospitals and other institutions.
This index usually leads CRE investment by 9 to 12 months, so this index suggests a slowdown in CRE investment in 2024.
Note that multi-family billing turned down in August 2022 and has been negative for twenty consecutive months (with revisions). This suggests we will see a further weakness in multi-family starts.
Final Look at Local Housing Markets in March
by Calculated Risk on 4/24/2024 09:49:00 AM
Today, in the Calculated Risk Real Estate Newsletter: Final Look at Local Housing Markets in March
A brief excerpt:
After the National Association of Realtors® (NAR) releases the monthly existing home sales report, I pick up additional local market data that is reported after the NAR. This is the final look at local markets in March.There is much more in the article.
I’ve added a comparison of active listings, new listings, and closings to the same month in 2019 (for markets with available data). This gives us a sense of the current low level of sales and inventory, and also shows some significant regional differences.
The big stories for March were that existing home sales decreased to 4.19 million on a seasonally adjusted annual rate basis (SAAR), and new listings were up YoY for the 6th consecutive month although new listing growth slowed.
...
And a table of March sales.
...
This was a 10.3% year-over-year decrease NSA for these markets. This is about the same as the 9.7% decline NSA reported by the NAR.
However, there were two fewer working days in March 2024 compared to March 2023, so sales Seasonally Adjusted were down less year-over-year than Not Seasonally Adjusted sales.
...
Note for next month (April sales): There were two more working days in April 2024 compared to April 2023, so seasonally adjusted sales will be lower than the NSA data suggests.
...
More local data coming in May for activity in April!

MBA: Mortgage Applications Decreased in Weekly Survey
by Calculated Risk on 4/24/2024 07:00:00 AM
From the MBA: Mortgage Applications Decrease in Latest MBA Weekly Survey
Mortgage applications decreased 2.7 percent from one week earlier, according to data from the Mortgage Bankers Association’s (MBA) Weekly Mortgage Applications Survey for the week ending April 19, 2024.
The Market Composite Index, a measure of mortgage loan application volume, decreased 2.7 percent on a seasonally adjusted basis from one week earlier. On an unadjusted basis, the Index decreased 2 percent compared with the previous week. The Refinance Index decreased 6 percent from the previous week and was 3 percent higher than the same week one year ago. The seasonally adjusted Purchase Index decreased 1 percent from one week earlier. The unadjusted Purchase Index increased 0.2 percent compared with the previous week and was 15 percent lower than the same week one year ago.
“Mortgage rates continued to move higher last week, reaching their highest levels since late 2023 and putting a damper on applications activity. The 30-year fixed rate increased for the third consecutive week to 7.24 percent, the highest since November 2023,” said Joel Kan, MBA’s Vice President and Deputy Chief Economist. “Purchase applications declined, as home buyers delayed their purchase decisions due to strained affordability and low supply. The ARM share of applications increased to 7.6 percent, consistent with the upward trend in rates, as buyers look to reduce their potential monthly payments.”
...
The average contract interest rate for 30-year fixed-rate mortgages with conforming loan balances ($766,550 or less) increased to 7.24 percent from 7.13 percent, with points increasing to 0.66 from 0.65 (including the origination fee) for 80 percent loan-to-value ratio (LTV) loans.
emphasis added
 Click on graph for larger image.
The first graph shows the MBA mortgage purchase index.
According to the MBA, purchase activity is down 15% year-over-year unadjusted.
Red is a four-week average (blue is weekly).
Purchase application activity is up slightly from the lows in late October 2023, and below the lowest levels during the housing bust.

The second graph shows the refinance index since 1990.
With higher mortgage rates, the refinance index declined sharply in 2022, and has mostly flat lined since then.
Tuesday, April 23, 2024
Wednesday: Durable Goods, Architecture Billings Index
by Calculated Risk on 4/23/2024 08:27:00 PM
 Note: Mortgage rates are from MortgageNewsDaily.com and are for top tier scenarios.
Wednesday:
• At 7:00 AM ET, The Mortgage Bankers Association (MBA) will release the results for the mortgage purchase applications index.
• At 8:30 AM, Durable Goods Orders for March from the Census Bureau. The consensus is for a 2.0% increase in durable goods orders.
• During the day, The AIA's Architecture Billings Index for March (a leading indicator for commercial real estate).
The Normal Seasonal Pattern for Median House Prices
by Calculated Risk on 4/23/2024 04:49:00 PM
Last week, in the CalculatedRisk Real Estate Newsletter on March existing home sales, NAR: Existing-Home Sales Decreased to 4.19 million SAAR in March; Median House Prices Increased 4.8% Year-over-Year, I noted that median prices were up year-over-year (median prices are distorted by the mix).
Seasonally prices typically peak in June (closed sales are mostly for contracts signed in April and May).
And seasonally prices usually bottom the following January (contracts signed in November and December).
The recent surge in prices started mid-year 2020 and ran through Q1 2022 when mortgage rates started increasing significantly.
The 2024 increase in median prices from January to March was about the same as in 2018 and 2019.
Here is a table of the seasonal percentage increases from January to March, and from March to June (the usual seasonal peak) over the last several years. The third row is the total percentage increase from January to June.
The last row shows the seasonal decline from June to December. Note: In 2019, prices only declined 3.8% in the 2nd half of the year as mortgage rates declined into the mid-3s (pre-pandemic low was 3.5% on a 30-year mortgage according to Freddie MAC PMMS).
In 2020, prices continued to increase in the 2nd half of the year and didn't peak seasonally until October. And prices only declined slightly in the 2nd half of 2021.
| 2018 | 2019 | 2020 | 2021 | 2022 | 2023 | 2024 | |
|---|---|---|---|---|---|---|---|
| Jan to Mar | 3.7% | 4.1% | 5.4% | 7.5% | 7.1% | 4.0% | 3.9% |
| Mar to Jun | 9.6% | 9.9% | 4.9% | 12.4% | 9.1% | 9.3% | NA |
| Total Jan to Jun | 13.7% | 14.4% | 10.6% | 20.8% | 16.8% | 13.7% | NA |
| Jun to Dec | -7.0% | -3.8% | 5.0% | -2.2% | -11.4% | -7.0% | NA |
The 2024 increase in median prices from January to March was about the same as in 2018 and 2019.
Normally we'd expect median prices to increase 9% to 10% over the next three months, before declining in the 2nd half of the year. With more inventory, the seasonal pattern will be interesting this year.
New Home Sales Increase to 693,000 Annual Rate in March; Median New Home Price is Down 13% from the Peak
by Calculated Risk on 4/23/2024 10:40:00 AM
Today, in the Calculated Risk Real Estate Newsletter: New Home Sales Increase to 693,000 Annual Rate in March
Brief excerpt:
The Census Bureau reports New Home Sales in March were at a seasonally adjusted annual rate (SAAR) of 693 thousand. The previous three months were revised down combined.There is much more in the article.
...
The next graph shows new home sales for 2023 and 2024 by month (Seasonally Adjusted Annual Rate). Sales in March 2024 were up 8.3% from March 2023.
...
Note that the median and average price are down due to the mix of homes sold, not because of large price declines. Homebuilders are building less expensive homes to keep up volumes.

New Home Sales Increase to 693,000 Annual Rate in March
by Calculated Risk on 4/23/2024 10:00:00 AM
The Census Bureau reports New Home Sales in March were at a seasonally adjusted annual rate (SAAR) of 693 thousand.
The previous three months were revised down combined.
Sales of new single‐family houses in March 2024 were at a seasonally adjusted annual rate of 693,000, according to estimates released jointly today by the U.S. Census Bureau and the Department of Housing and Urban Development. This is 8.8 percent above the revised February rate of 637,000 and is 8.3 percent above the March 2023 estimate of 640,000.
emphasis added
 Click on graph for larger image.
The first graph shows New Home Sales vs. recessions since 1963. The dashed line is the current sales rate.
New home sales were close to pre-pandemic levels.
The second graph shows New Home Months of Supply.
 The months of supply decreased in March to 8.3 months from 8.8 months in February.
 The all-time record high was 12.2 months of supply in January 2009. The all-time record low was 3.3 months in August 2020.
This is well above the top of the normal range (about 4 to 6 months of supply is normal).
"The seasonally‐adjusted estimate of new houses for sale at the end of March was 477,000. This represents a supply of 8.3 months at the current sales rate."Sales were above expectations of 670 thousand SAAR, however, sales for the three previous months were revised down, combined. I'll have more later today.
Monday, April 22, 2024
Tuesday: New Home Sales
by Calculated Risk on 4/22/2024 08:08:00 PM
 From Matthew Graham at Mortgage News Daily: Mortgage Rates Essentially Flat Just Under 5 Month Highs
Mortgage rates began the new week at almost exactly the same levels seen at the end of last week. There were no major events or economic reports to cause volatility in the underlying bond market, but bonds were able to improve modestly by the end of the day.Tuesday:
...
By staying near Friday's levels, the average lender is just shy of the highest rates in 5 months. A top tier conventional 30yr fixed scenario is still in the mid 7% range. [30 year fixed 7.43%]
emphasis added
• At 10:00 AM ET, New Home Sales for March from the Census Bureau. The consensus is for 670 thousand SAAR, up from 662 thousand in February.
• Also at 10:00 AM, Richmond Fed Survey of Manufacturing Activity for April.
MBA Survey: Share of Mortgage Loans in Forbearance Holds Steady at 0.22% in March
by Calculated Risk on 4/22/2024 04:13:00 PM
From the MBA: Share of Mortgage Loans in Forbearance Remains at 0.22% in March
The Mortgage Bankers Association’s (MBA) monthly Loan Monitoring Survey revealed that the total number of loans now in forbearance remained unchanged at 0.22% as of March 31, 2024. According to MBA’s estimate, 110,000 homeowners are in forbearance plans. Mortgage servicers have provided forbearance to approximately 8.1 million borrowers since March 2020.At the end of March, there were about 110,000 homeowners in forbearance plans.
In March 2024, the share of Fannie Mae and Freddie Mac loans in forbearance remained at 0.12%. Ginnie Mae loans in forbearance stayed at 0.40%, and the forbearance share for portfolio loans and private-label securities (PLS) increased 2 basis points to 0.31%.
“For the past three months, the number of loans in forbearance has held steady,” said Marina Walsh, CMB, MBA’s Vice President of Industry Analysis. “The current labor market is showing resilience, minimizing the need for mortgage forbearance. However, life events and temporary hardships still happen, regardless of employment conditions, which may explain why we have reached a floor in the forbearance rate.”
emphasis added

In Memoriam: Doris "Tanta" Dungey


| Privacy Policy |
| Copyright © 2007 - 2025 CR4RE LLC |
| Excerpts NOT allowed on x.com |