 RSS Feed
 by Calculated Risk on 4/30/2023 06:33:00 PM
Sunday, April 30, 2023
Monday: ISM Mfg, Construction Spending
Weekend:
• Schedule for Week of April 30, 2023
Monday:
• At 10:00 AM ET, ISM Manufacturing Index for April. The consensus is for the ISM to be at 46.8, up from 46.3 in March.
• Also at 10:00 AM, Construction Spending for March. The consensus is for a 0.2% increase in construction spending.
From CNBC: Pre-Market Data and Bloomberg futures S&P 500 and DOW futures are up slightly (fair value).
Oil prices were down over the last week with WTI futures at $76.78 per barrel and Brent at $80.33 per barrel. A year ago, WTI was at $105, and Brent was at $108 - so WTI oil prices are down about 25% year-over-year.
Here is a graph from Gasbuddy.com for nationwide gasoline prices. Nationally prices are at $3.58 per gallon. A year ago, prices were at $4.17 per gallon, so gasoline prices are down $0.59 per gallon year-over-year.
FOMC Preview: Likely 25bp Hike
by Calculated Risk on 4/30/2023 09:01:00 AM
Most analysts expect the FOMC to raise rates 25 basis points and then hint at a pause in June, although it is possible that the FOMC will not increase rates at the meeting this week. However, there hasn't been any leaks of a possible pause at this meeting - so 25 basis points is likely.
In January, the FOMC suggested that there would be "ongoing increases" in the target range:
1 Projections of change in real GDP and inflation are from the fourth quarter of the previous year to the fourth quarter of the year indicated.
The unemployment rate was at 3.5% in March. To reach the mid-point of the FOMC projections for Q4 2023, the economy would likely have to lose 1 to 2 million jobs by Q4.
2 Projections for the unemployment rate are for the average civilian unemployment rate in the fourth quarter of the year indicated.
As of March 2022, PCE inflation increased 4.2 percent year-over-year (YoY), down from 5.1 percent YoY in February.
PCE core inflation was up 4.6% in March year-over-year. This remains a concern for the FOMC, however this includes shelter that was up 8.3% YoY in March.
"The Committee anticipates that ongoing increases in the target range will be appropriate in order to attain a stance of monetary policy that is sufficiently restrictive to return inflation to 2 percent over time."Then the stresses in the banking system became apparent and inflation eased somewhat quicker than expected. The FOMC statement in March suggested some additional tightening may be appropriate:
emphasis
"The Committee anticipates that some additional policy firming may be appropriate in order to attain a stance of monetary policy that is sufficiently restrictive to return inflation to 2 percent over time."
On the meeting this week from BofA:
"We expect the Fed to hike by 25bp at next week’s meeting. More importantly, we think the Fed will signal a pause in June, with a weak bias to hike rather than cut rates going forward. ... The challenge will be to credibly signal an extended hold and push back against market pricing of rate cuts (roughly 60bp in 2023 and 150bp in 2024 at the time of this writing), particularly given the latest bout of banking sector stress.And from Goldman Sachs economists:
Note that the Fed will have the results of the 2Q Senior Loan Officer Opinion Survey (SLOOS) in hand for the May meeting, although the survey results will only be made public in the following week. The Beige Book shows that six of the 12 regional Fed banks reported further credit tightening since the January survey. This suggests that the SLOOS data will reinforce the case for a pause in June.
emphasis added
The FOMC is likely to deliver a widely expected 25bp rate hike to 5-5.25% at its May meeting, but the focus will be on revisions to the forward guidance in its statement. We expect the Committee to signal that it anticipates pausing in June but retains a hawkish bias, stopping earlier than it initially envisioned because bank stress is likely to cause a tightening of credit.
No projections will be released at this meeting. For review, here are the March projections. Since the last projections were released, the economy has performed better than the FOMC expected, and inflation was close to expectations.
The BEA reported real GDP increased at a 1.1% annual rate in Q1. However, the change in private inventories subtracted 2.26 percentage points from GDP in Q1, and personal consumption expenditures (PCE) increased at a 3.7% annual rate indicating some underlying economic strength. Essentially the FOMC is forecasting a recession in the 2nd half of 2023 with these projections.
| GDP projections of Federal Reserve Governors and Reserve Bank presidents, Change in Real GDP1 | ||||
|---|---|---|---|---|
| Projection Date | 2023 | 2024 | 2025 | |
| Mar 2023 | 0.0 to 0.8 | 1.0 to 1.5 | 1.7 to 2.1 | |
The unemployment rate was at 3.5% in March. To reach the mid-point of the FOMC projections for Q4 2023, the economy would likely have to lose 1 to 2 million jobs by Q4.
| Unemployment projections of Federal Reserve Governors and Reserve Bank presidents, Unemployment Rate2 | ||||
|---|---|---|---|---|
| Projection Date | 2023 | 2024 | 2025 | |
| Mar 2023 | 4.0 to 4.7 | 4.3 to 4.9 | 4.3 to 4.8 | |
As of March 2022, PCE inflation increased 4.2 percent year-over-year (YoY), down from 5.1 percent YoY in February.
| Inflation projections of Federal Reserve Governors and Reserve Bank presidents, PCE Inflation1 | ||||
|---|---|---|---|---|
| Projection Date | 2023 | 2024 | 2025 | |
| Mar 2023 | 3.0 to 3.8 | 2.2 to 2.8 | 2.0 to 2.2 | |
PCE core inflation was up 4.6% in March year-over-year. This remains a concern for the FOMC, however this includes shelter that was up 8.3% YoY in March.
| Core Inflation projections of Federal Reserve Governors and Reserve Bank presidents, Core Inflation1 | ||||
|---|---|---|---|---|
| Projection Date | 2023 | 2024 | 2025 | |
| Mar 2023 | 3.5 to 3.9 | 2.3 to 2.8 | 2.0 to 2.2 | |
Saturday, April 29, 2023
Real Estate Newsletter Articles this Week: Case-Shiller House Prices up 2.0% YoY
by Calculated Risk on 4/29/2023 02:11:00 PM
At the Calculated Risk Real Estate Newsletter this week:
• Case-Shiller: National House Price Index "Declines Moderated" to 2.0% year-over-year increase in February
• New Home Sales Increase to 683,000 Annual Rate in March
• Inflation Adjusted House Prices 4.6% Below Peak
• Final Look at Local Housing Markets in March
• NMHC: "Apartment Market Continues to Loosen"
• Freddie Mac House Price Index Increased Slightly in March; Up 1.0% Year-over-year
This is usually published 4 to 6 times a week and provides more in-depth analysis of the housing market.
You can subscribe at https://calculatedrisk.substack.com/
Most content is available for free (and no Ads), but please subscribe!
Schedule for Week of April 30, 2023
by Calculated Risk on 4/29/2023 08:11:00 AM
The key report scheduled for this week is the April employment report.
Other key reports include April vehicle sales, and the March trade balance.
The FOMC meets this week, and the FOMC is expected to raise rates 25bp.
For manufacturing, the April ISM manufacturing index will be released.
10:00 AM ET: ISM Manufacturing Index for April. The consensus is for the ISM to be at 46.8, up from 46.3 in March.
10:00 AM: Construction Spending for March. The consensus is for a 0.2% increase in construction spending.
8:00 AM ET: Corelogic House Price index for March.
 10:00 AM ET: Job Openings and Labor Turnover Survey for March from the BLS.
 This graph shows job openings (black line), hires (dark blue), Layoff, Discharges and other (red column), and Quits (light blue column) from the JOLTS.
Jobs openings decreased in February to 9.9 million from 10.6 million in January.
The number of job openings (black) were down 14% year-over-year in February.
 All day: Light vehicle sales for April. The expectation is for light vehicle sales to be 14.8 million SAAR in April, unchanged from 14.8 million in March (Seasonally Adjusted Annual Rate).
This graph shows light vehicle sales since the BEA started keeping data in 1967. The dashed line is the sales rate for the previous month.
7:00 AM ET: The Mortgage Bankers Association (MBA) will release the results for the mortgage purchase applications index.
8:15 AM: The ADP Employment Report for April. This report is for private payrolls only (no government). The consensus is for 135,000 payroll jobs added in April, down from 145,000 added in March.
10:00 AM: the Q1 2023 Housing Vacancies and Homeownership from the Census Bureau.
10:00 AM: the ISM Services Index for April. The consensus is for a reading of 51.7, up from 51.2.
2:00 PM: FOMC Meeting Announcement. The FOMC is expected to raise the Fed Funds rate by 25bp at this meeting and indicate a likely "pause" in June.
2:30 PM: Fed Chair Jerome Powell holds a press briefing following the FOMC announcement.
8:30 AM: The initial weekly unemployment claims report will be released. The consensus is for 243 thousand initial claims, up from 230 thousand last week.
 8:30 AM: Trade Balance report for March from the Census Bureau.
 This graph shows the U.S. trade deficit, with and without petroleum, through the most recent report. The blue line is the total deficit, and the black line is the petroleum deficit, and the red line is the trade deficit ex-petroleum products.
The consensus is the trade deficit to be $63.8 billion. The U.S. trade deficit was at $70.3 billion in February.
 8:30 AM: Employment Report for April. The consensus is for 178,000 jobs added, and for the unemployment rate to increase to 3.6%.
There were 236,000 jobs added in March, and the unemployment rate was at 3.5%.
This graph shows the jobs added per month since January 2022.
Friday, April 28, 2023
COVID Apr 28, 2023, Update: New Pandemic Low for Weekly Deaths
by Calculated Risk on 4/28/2023 09:00:00 PM
 Note: Mortgage rates are from MortgageNewsDaily.com and are for top tier scenarios.
On COVID (focus on hospitalizations and deaths). Data is now weekly.
After the first few weeks, the pandemic low for weekly deaths had been the week of July 7, 2021, at 1,690 deaths (until recently).
For cases, the low was 82,186 (getting close).
For COVID hospitalizations, the low was 9,821 (also getting close).
| COVID Metrics | ||||
|---|---|---|---|---|
| Now | Week Ago | Goal | ||
| New Cases per Week2 | 88,330 | 97,893 | ≤35,0001 | |
| Hospitalized2 | 9,876 | 11,497 | ≤3,0001 | |
| Deaths per Week2 | 1,052 | 1,246 | ≤3501 | |
| 1my goals to stop weekly posts, 2Weekly for Cases, Currently Hospitalized, and Deaths 🚩 Increasing number weekly for Cases, Hospitalized, and Deaths ✅ Goal met. | ||||
 Click on graph for larger image.
This graph shows the weekly (columns) number of deaths reported.
Weekly deaths decreased this week and set a new pandemic low of 1,052 deaths in the most recent week.
Hotels: Occupancy Rate Up 2.3% Year-over-year
by Calculated Risk on 4/28/2023 03:28:00 PM
U.S. hotel performance increased from the previous week, according to STR‘s latest data through April 22.The following graph shows the seasonal pattern for the hotel occupancy rate using the four-week average.
April 16-22, 2023 (percentage change from comparable week in 2022):
• Occupancy: 67.2% (+2.3%)
• Average daily rate (ADR): $155.76 (+4.2%)
• Revenue per available room (RevPAR): $104.64 (+6.6%)
emphasis added
 Click on graph for larger image.
The red line is for 2023, black is 2020, blue is the median, and dashed light blue is for 2022. Dashed purple is for 2018, the record year for hotel occupancy.
The 4-week average of the occupancy rate is close to the median rate for the period 2000 through 2020 (Blue).
Note: Y-axis doesn't start at zero to better show the seasonal change.
The 4-week average of the occupancy rate will move mostly sideways until the summer travel season.
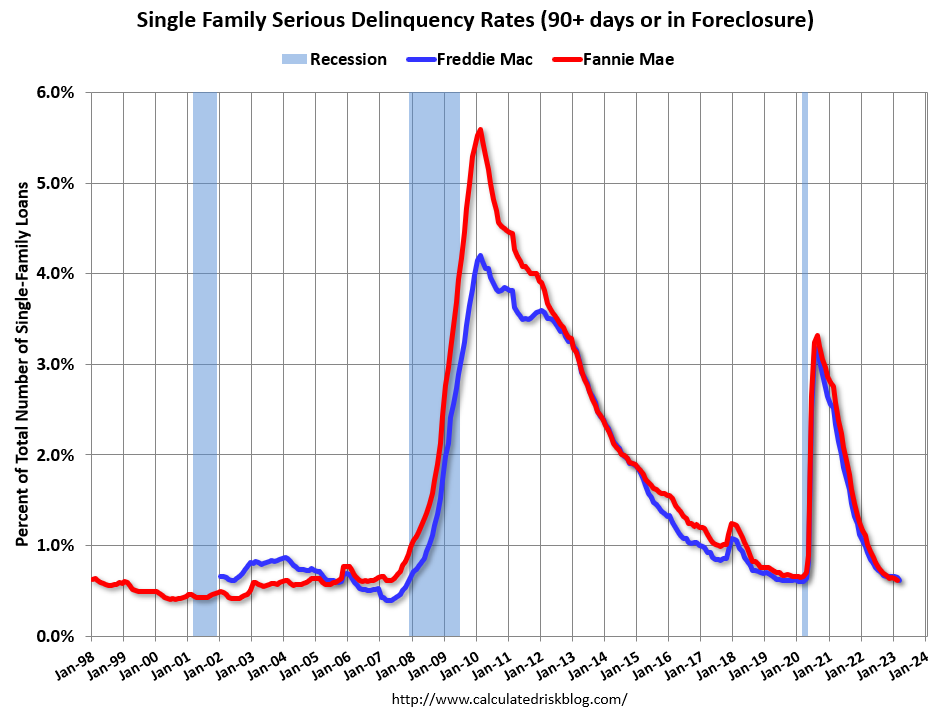
Fannie Mae: Mortgage Serious Delinquency Rate Decreased in March
by Calculated Risk on 4/28/2023 01:41:00 PM
Fannie Mae reported that the Single-Family Serious Delinquency decreased to 0.59% in March from 0.62% in February. The serious delinquency rate is down from 1.01% in March 2022. This is below the pre-pandemic levels.
These are mortgage loans that are "three monthly payments or more past due or in foreclosure".
The Fannie Mae serious delinquency rate peaked in February 2010 at 5.59% following the housing bubble and peaked at 3.32% in August 2020 during the pandemic.
 Click on graph for larger image
By vintage, for loans made in 2004 or earlier (1% of portfolio), 1.93% are seriously delinquent (down from 2.04% in February).
For loans made in 2005 through 2008 (1% of portfolio), 3.11% are seriously delinquent (down from 3.31%),
For recent loans, originated in 2009 through 2021 (98% of portfolio), 0.48% are seriously delinquent (down from 0.51%). So, Fannie is still working through a few poor performing loans from the bubble years.
Mortgages in forbearance were counted as delinquent in this monthly report, but they were not reported to the credit bureaus.
Mortgages in forbearance were counted as delinquent in this monthly report, but they were not reported to the credit bureaus.
Freddie Mac reported earlier.
Freddie Mac House Price Index Increased Slightly in March; Up 1.0% Year-over-year
by Calculated Risk on 4/28/2023 11:16:00 AM
Today, in the Calculated Risk Real Estate Newsletter: Freddie Mac House Price Index Increased Slightly in March; Up 1.0% Year-over-year
A brief excerpt:
Freddie Mac reported that its “National” Home Price Index (FMHPI) increased 0.3% month-over-month on a seasonally adjusted (SA) basis in March, putting the National FMHPI down 1.3% SA from its June 2022 peak, and down 2.6% Not Seasonally Adjusted (NSA) from the peak.There is much more in the article. You can subscribe at https://calculatedrisk.substack.com/
On a year-over-year basis, the National FMHPI was up 1.0% in March, down from 2.1% YoY in February. The YoY increase peaked at 19.2% in July 2021. ...
In March, 24 states and D.C. were below their 2022 peaks, Seasonally Adjusted. The largest seasonally adjusted declines from the recent peak were in Idaho (-8.8%), Nevada (-7.9%), Arizona (-6.8%), Utah (-6.5%), Washington (-6.3%), California (-5.6%), and Colorado (-4.4%).
In March, house prices in 9 states and D.C. were down YoY, led by Idaho (-7.5% YoY), Nevada (-6.3%) and Washington (-5.1%).
For cities (Core-based Statistical Areas, CBSA), here are the 30 cities with the largest declines from the peak, seasonally adjusted.

PCE Measure of Shelter Still Accelerating YoY
by Calculated Risk on 4/28/2023 08:59:00 AM
Here is a graph of the year-over-year change in shelter from the CPI report and housing from the PCE report this morning, both through March 2023:
 CPI Shelter was up 8.2% year-over-year in March, up from 8.1% in February.
Housing (PCE) was up 8.3% YoY in March, from 8.2% in February.
Since rents are soft and "Apartment Market Continues to Loosen" this means both CPI and PCE measures are currently overstating actual inflation.
Since rents are soft and "Apartment Market Continues to Loosen" this means both CPI and PCE measures are currently overstating actual inflation.
Personal Income increased 0.3% in March; Spending increased Slightly
by Calculated Risk on 4/28/2023 08:40:00 AM
The BEA released the Personal Income and Outlays report for March:
Personal income increased $67.9 billion (0.3 percent) in March, according to estimates released today by the Bureau of Economic Analysis. Disposable personal income (DPI) increased $71.7 billion (0.4 percent) and personal consumption expenditures (PCE) increased $8.2 billion (less than 0.1 percent).The March PCE price index increased 4.2 percent year-over-year (YoY), down from 5.1 percent YoY in February, and down from the recent peak of 7.0 percent in June 2022.
The PCE price index increased 0.1 percent. Excluding food and energy, the PCE price index increased 0.3 percent. Real DPI increased 0.3 percent in March and Real PCE decreased less than 0.1 percent; goods decreased 0.4 percent and services increased 0.1 percent.
emphasis added
The PCE price index, excluding food and energy, increased 4.6 percent YoY, down from 4.7 percent in February, and down from the recent peak of 5.4 percent in February 2022.
The following graph shows real Personal Consumption Expenditures (PCE) through March 2023 (2012 dollars). Note that the y-axis doesn't start at zero to better show the change.
 Click on graph for larger image.
The dashed red lines are the quarterly levels for real PCE.
Personal income and PCE were slightly above expectations.
Inflation was close to expectations.
Thursday, April 27, 2023
Friday: Personal Income & Outlays
by Calculated Risk on 4/27/2023 08:50:00 PM
 Note: Mortgage rates are from MortgageNewsDaily.com and are for top tier scenarios.
Friday:
• At 8:30 AM ET, Personal Income and Outlays, March 2023. The consensus is for a 0.2% increase in personal income, and for a 0.1% decrease in personal spending. And for the Core PCE price index to increase 0.3%. PCE prices are expected to be up 4.1% YoY, and core PCE prices up 4.5% YoY.
• At 9:45 AM, Chicago Purchasing Managers Index for April. The consensus is for a reading of 43.5, down from 43.8 in March.
• At 10:00 AM, University of Michigan's Consumer sentiment index (Final for April). The consensus is for a reading of 63.5.
Realtor.com Reports Weekly Active Inventory Up 39% YoY; New Listings Down 21% YoY
by Calculated Risk on 4/27/2023 02:52:00 PM
Realtor.com has monthly and weekly data on the existing home market. Here is their weekly report released today from chief economist Danielle Hale: Weekly Housing Trends View — Data Week Ending Apr 22, 2023
• Active inventory was up at a slower pace, with for-sale homes up just 39% above one year ago. The number of homes for sale continues to climb, but hesitant seller participation is limiting the pace of growth. As a result, a greater share of current for-sale inventory is new construction.
...
• New listings–a measure of sellers putting homes up for sale–were down again this week, by 21% from one year ago. The number of newly listed homes has been lower than the same time the previous year for the past 42 weeks.
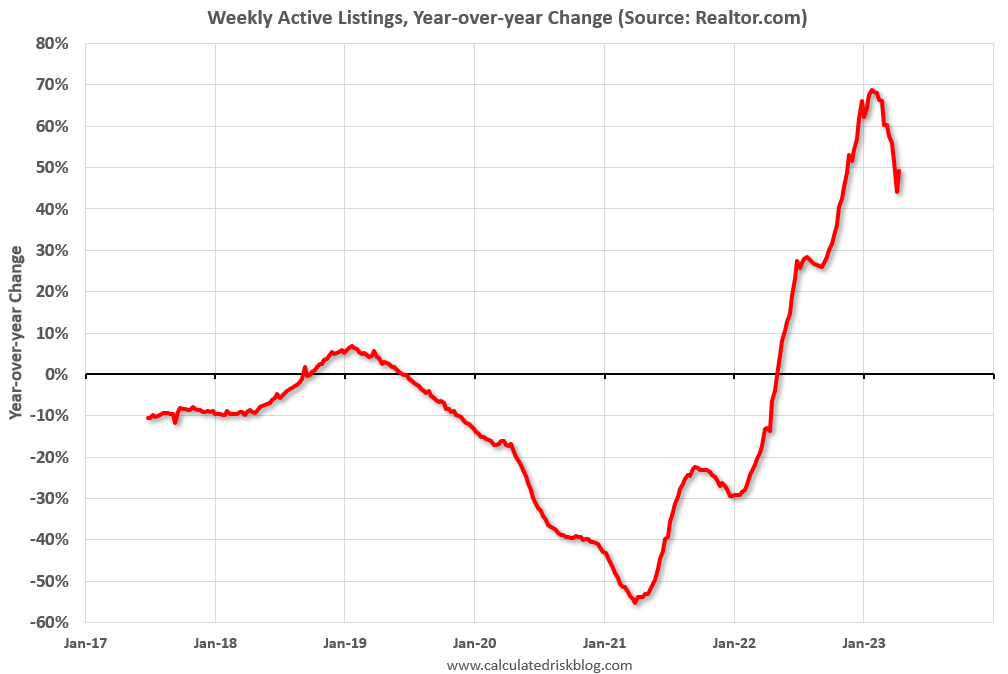
 Here is a graph of the year-over-year change in inventory according to realtor.com.
 Inventory is still up year-over-year - from record lows - however, the YoY increase has slowed sharply recently.
This was the smallest YoY increase since October.
The recent trend suggests active inventory could be down YoY in Q3!
NMHC: "Apartment Market Continues to Loosen"
by Calculated Risk on 4/27/2023 12:00:00 PM
Today, in the Calculated Risk Real Estate Newsletter: NMHC: "Apartment Market Continues to Loosen"
A brief excerpt:
From the NMHC: Apartment Market Continues to Loosen, Transactions Pull Back Further Amidst Economic UncertaintyThere is more in the article. You can subscribe at https://calculatedrisk.substack.com/“Apartment operators reported an uptick in vacancies and concessions this quarter,” noted NMHC’s Vice President of Research Caitlin Sugrue Walter.
...
• The Market Tightness Index came in at 31 this quarter—below the breakeven level (50)—indicating looser market conditions for the third consecutive quarter. More than half of respondents (51%) reported markets to be looser than three months ago, while only 14% thought markets have become tighter. Meanwhile, around a third of respondents (34%) thought that market conditions were unchanged over the past three months.
NAR: Pending Home Sales Decreased 5.2% in March; Down 23.2% Year-over-year
by Calculated Risk on 4/27/2023 10:03:00 AM
From the NAR: Pending Home Sales Decreased 5.2% in March
Pending home sales decreased in March for the first time since November 2022, according to the National Association of REALTORS®. Three U.S. regions posted monthly losses, while the South increased. All four regions saw year-over-year declines in transactions.This is way below expectations of a 1.0% decrease for this index. Note: Contract signings usually lead sales by about 45 to 60 days, so this would usually be for closed sales in April and May.
The Pending Home Sales Index (PHSI)* – a forward-looking indicator of home sales based on contract signings – waned by 5.2% to 78.9 in March. Year over year, pending transactions dropped by 23.2%. An index of 100 is equal to the level of contract activity in 2001.
"The lack of housing inventory is a major constraint to rising sales," said NAR Chief Economist Lawrence Yun. "Multiple offers are still occurring on about a third of all listings, and 28% of homes are selling above list price. Limited housing supply is simply not meeting demand nationally."
...
The Northeast PHSI fell 8.1% from last month to 66.6, a decline of 24.3% from March 2022. The Midwest index dropped 10.7% to 75.7 in March, down 21.5% from one year ago.
The South PHSI improved 0.2% to 99.6 in March, falling 19.8% from the prior year. The West index decreased 8.0% in March to 59.4, reducing 32.2% from March 2022.
emphasis added
BEA: Real GDP increased at 1.1% Annualized Rate in Q1
by Calculated Risk on 4/27/2023 08:38:00 AM
From the BEA: Gross Domestic Product, First Quarter 2023 (Advance Estimate)
Real gross domestic product (GDP) increased at an annual rate of 1.1 percent in the first quarter of 2023, according to the "advance" estimate released by the Bureau of Economic Analysis. In the fourth quarter, real GDP increased 2.6 percent.PCE increased at a 3.7% annual rate, and residential investment decreased at a 4.2% rate. The advance Q1 GDP report, with 1.1% annualized increase, was below expectations.
The increase in real GDP reflected increases in consumer spending, exports, federal government spending, state and local government spending, and nonresidential fixed investment that were partly offset by decreases in private inventory investment and residential fixed investment. Imports, which are a subtraction in the calculation of GDP, increased .
The increase in consumer spending reflected increases in both goods and services. Within goods, the leading contributor was motor vehicles and parts. Within services, the increase was led by health care and food services and accommodations. Within exports, an increase in goods (led by consumer goods, except food and automotive) was partly offset by a decrease in services (led by transport). Within federal government spending, the increase was led by nondefense spending. The increase in state and local government spending primarily reflected an increase in compensation of state and local government employees. Within nonresidential fixed investment, increases in structures and intellectual property products were partly offset by a decrease in equipment.
The decrease in private inventory investment was led by wholesale trade (notably, machinery, equipment, and supplies) and manufacturing (led by other transportation equipment as well as petroleum and coal products). Within residential fixed investment, the leading contributor to the decrease was new single-family construction. Within imports, the increase reflected an increase in goods (mainly durable consumer goods and automotive vehicles, engines, and parts).
emphasis added
The decrease in inventories subtracted 2.26 percentage points from GDP.
I'll have more later ...
I'll have more later ...
Weekly Initial Unemployment Claims decrease to 230,000
by Calculated Risk on 4/27/2023 08:32:00 AM
The DOL reported:
In the week ending April 22, the advance figure for seasonally adjusted initial claims was 230,000, a decrease of 16,000 from the previous week's revised level. The previous week's level was revised up by 1,000 from 245,000 to 246,000. The 4-week moving average was 236,000, a decrease of 4,000 from the previous week's revised average. The previous week's average was revised up by 250 from 239,750 to 240,000.The following graph shows the 4-week moving average of weekly claims since 1971.
emphasis added
 Click on graph for larger image.
The dashed line on the graph is the current 4-week average. The four-week average of weekly unemployment claims decreased to 236,000.
The previous week was revised up.
Weekly claims were below the consensus forecast.
Wednesday, April 26, 2023
Thursday: GDP, Unemployment Claims, Pending Home Sales
by Calculated Risk on 4/26/2023 08:55:00 PM
 Note: Mortgage rates are from MortgageNewsDaily.com and are for top tier scenarios.
Thursday:
• At 8:30 AM ET, The initial weekly unemployment claims report will be released. The consensus is for 250 thousand initial claims, up from 245 thousand last week.
• Also at 8:30 AM, Gross Domestic Product, 1st quarter 2023 (Advance estimate). The consensus is that real GDP increased 2.0% annualized in Q1, down from 2.6% in Q4.
• At 10:00 AM, Pending Home Sales Index for March. The consensus is for a 1.0% increase in the index.
• At 11:00 AM, the Kansas City Fed manufacturing survey for April. This is the last of regional manufacturing surveys for April.
Freddie Mac: Mortgage Serious Delinquency Rate Decreased in March
by Calculated Risk on 4/26/2023 01:37:00 PM
Freddie Mac reported that the Single-Family serious delinquency rate in March was 0.62%, down from 0.65% February. Freddie's rate is down year-over-year from 0.92% in March 2022.
Freddie's serious delinquency rate peaked in February 2010 at 4.20% following the housing bubble and peaked at 3.17% in August 2020 during the pandemic.
These are mortgage loans that are "three monthly payments or more past due or in foreclosure".
 Click on graph for larger image
Mortgages in forbearance are being counted as delinquent in this monthly report but are not reported to the credit bureaus.
The serious delinquency rate was at 0.60% just prior to the pandemic; this is almost back to that level.
Note that multi-family delinquencies have been increasing and were at 0.13% in March, up from 0.08% in March 2022.
Inflation Adjusted House Prices 4.6% Below Peak; Price-to-rent index is 8.4% below recent peak
by Calculated Risk on 4/26/2023 10:17:00 AM
Today, in the Calculated Risk Real Estate Newsletter: Inflation Adjusted House Prices 4.6% Below Peak; Price-to-rent index is 8.4% below recent peak
Excerpt:
It has been 17 years since the bubble peak. In the January Case-Shiller house price index released on Tuesday, the seasonally adjusted National Index (SA), was reported as being 61% above the bubble peak in 2006. However, in real terms, the National index (SA) is about 11% above the bubble peak (and historically there has been an upward slope to real house prices). The composite 20, in real terms, is at the bubble peak.
The inflation adjusted indexes have declined for nine consecutive months in real terms.
People usually graph nominal house prices, but it is also important to look at prices in real terms. As an example, if a house price was $200,000 in January 2000, the price would be almost $340,000 today adjusted for inflation (70% increase). That is why the second graph below is important - this shows "real" prices.
The third graph shows the price-to-rent ratio, and the fourth graph is the affordability index.
There is much more in the article. You can subscribe at https://calculatedrisk.substack.com/
MBA: Mortgage Applications Increased in Weekly Survey
by Calculated Risk on 4/26/2023 07:00:00 AM
From the MBA: Mortgage Applications Increase in Latest MBA Weekly Survey
Mortgage applications increased 3.7 percent from one week earlier, according to data from the Mortgage Bankers Association’s (MBA) Weekly Mortgage Applications Survey for the week ending April 21, 2023.
The Market Composite Index, a measure of mortgage loan application volume, increased 3.7 percent on a seasonally adjusted basis from one week earlier. On an unadjusted basis, the Index increased 5 percent compared with the previous week. The Refinance Index increased 2 percent from the previous week and was 51 percent lower than the same week one year ago. The seasonally adjusted Purchase Index increased 5 percent from one week earlier. The unadjusted Purchase Index increased 6 percent compared with the previous week and was 28 percent lower than the same week one year ago.
“Both conventional and government home purchase applications increased last week. However, activity was still nearly 28 percent below last year’s pace, as high mortgage rates and low supply have slowed the market this year, even as home-price growth has decelerated in many markets across the country,” said Joel Kan, MBA’s Vice President and Deputy Chief Economist. “Refinance applications also increased last week but remained at half of last year’s levels. Although incoming data points to a slowdown in the U.S. economy, markets continue to expect that the Fed will raise short-term rates at its next meeting, which have pushed Treasury yields somewhat higher. As a result of the higher yields, mortgage rates increased for the second straight week to their highest level in over a month, with the 30-year fixed rate now at 6.55 percent.”
..
The average contract interest rate for 30-year fixed-rate mortgages with conforming loan balances ($726,200 or less) increased to 6.55 percent from 6.43 percent, with points remaining at 0.63 (including the origination fee) for 80 percent loan-to-value ratio (LTV) loans.
emphasis added
 Click on graph for larger image.
The first graph shows the MBA mortgage purchase index.
According to the MBA, purchase activity is down 28% year-over-year unadjusted.
Red is a four-week average (blue is weekly).

The second graph shows the refinance index since 1990.
With higher mortgage rates, the refinance index declined sharply in 2022.
Tuesday, April 25, 2023
Wednesday: Durable Goods
by Calculated Risk on 4/25/2023 09:01:00 PM
 Note: Mortgage rates are from MortgageNewsDaily.com and are for top tier scenarios.
Wednesday:
• At 7:00 AM ET, The Mortgage Bankers Association (MBA) will release the results for the mortgage purchase applications index.
• At 8:30 AM, Durable Goods Orders for March from the Census Bureau. The consensus is for a 0.9% increase in durable goods orders.
Las Vegas March 2023: Visitor Traffic Down 1.1% Compared to 2019; Convention Traffic Up 39.6%
by Calculated Risk on 4/25/2023 02:07:00 PM
Note: I like using Las Vegas as a measure of recovery for both leisure (visitors) and business (conventions). Vegas is Back!
From the Las Vegas Visitor Authority: March 2023 Las Vegas Visitor Statistics
Benefitting from a mix of headliners and events from NASCAR to Taylor Swift to several college basketball tournaments, paired with a robust convention month that included the triennial CONEXPO‐CON/AGG tradeshow and its 140k+ attendees, Las Vegas visitation neared 3.7M in Mar 2023, up +9.6% YoY and nearly matching Mar 2019.
Overall hotel occupancy exceeded 88% for the month, +7.7 pts YoY. Achieving impressive levels by both pre and post‐pandemic standards, Weekend occupancy reached 94.5% for the month (+2.4 pts YoY) while conventions helped propel Midweek occupancy to 85.8%, +9.2 pts YoY.
Overall ADR exceeded $213, breaking the record from just a few months ago (Oct 2022, $208) and surpassing Mar 2022 and Mar 2019 by +30.7% and +59.2%, respectively. RevPAR also broke records, reaching $188, +43.2% YoY and +53.6% over Mar 2019
 Click on graph for larger image.
 The first graph shows visitor traffic for 2019 (Black), 2020 (light blue), 2021 (purple), 2022 (orange), and 2023 (red).
Visitor traffic was down 1.1% compared to the same month in 2019.
Visitor traffic was up 9.6% compared to last March.
The second graph shows convention traffic.

Convention traffic was up 39.6% compared to March 2019, and up 56.0% compared to March 2022.The second graph shows convention traffic.

Note: There was almost no convention traffic from April 2020 through May 2021.
New Home Sales Increase to 683,000 Annual Rate in March; Likely New Home Sales will be up YoY in Mid-2023
by Calculated Risk on 4/25/2023 10:50:00 AM
Today, in the Calculated Risk Real Estate Newsletter: New Home Sales Increase to 683,000 Annual Rate in March
Brief excerpt:
The next graph shows new home sales for 2022 and 2023 by month (Seasonally Adjusted Annual Rate). Sales in March 2023 were down 3.4% from March 2022.You can subscribe at https://calculatedrisk.substack.com/.
It seems likely that new home sales will be up year-over-year sometime in the next few months.
...
As previously discussed, the Census Bureau overestimates sales, and underestimates inventory when cancellation rates are rising, see: New Home Sales and Cancellations: Net vs Gross Sales. This has reversed now since cancellation rates have started to decline. When a previously cancelled home is resold, the home builder counts it as a sale, but the Census Bureau does not (since it was already counted).
There are still a large number of homes under construction, and this suggests we might see a further increase in completed inventory over the next several months, but in general, this is a positive report for new home sales.

New Home Sales Increase to 683,000 Annual Rate in March
by Calculated Risk on 4/25/2023 10:07:00 AM
The Census Bureau reports New Home Sales in March were at a seasonally adjusted annual rate (SAAR) of 683 thousand.
The previous three months were revised down slightly, combined.
Sales of new single‐family houses in March 2023 were at a seasonally adjusted annual rate of 683,000, according to estimates released jointly today by the U.S. Census Bureau and the Department of Housing and Urban Development. This is 9.6 percent above the revised February rate of 623,000, but is 3.4 percent below the March 2022 estimate of 707,000.
emphasis added
 Click on graph for larger image.
The first graph shows New Home Sales vs. recessions since 1963. The dashed line is the current sales rate.
New home sales are close to pre-pandemic levels.
The second graph shows New Home Months of Supply.
 The months of supply decreased in March to 7.6 months from 8.4 months in February.
 The all-time record high was 12.2 months of supply in January 2009. The all-time record low was 3.3 months in August 2020.
This is well above the top of the normal range (about 4 to 6 months of supply is normal).
"The seasonally‐adjusted estimate of new houses for sale at the end of March was 432,000. This represents a supply of 7.6 months at the current sales rate."Sales were above expectations of 630 thousand SAAR, however, sales in the three previous months were revised down slightly, combined. I'll have more later today.
Comments on February Case-Shiller and FHFA House Prices
by Calculated Risk on 4/25/2023 09:46:00 AM
Today, in the Calculated Risk Real Estate Newsletter: Case-Shiller: National House Price Index "Declines Moderated" to 2.0% year-over-year increase in February
Excerpt:
Both the Case-Shiller House Price Index (HPI) and the Federal Housing Finance Agency (FHFA) HPI for February were released today. Here is a graph of the month-over-month (MoM) change in the Case-Shiller National Index Seasonally Adjusted (SA).
The Case-Shiller Home Price Indices for "February" is a 3-month average of December, January and February closing prices. December closing prices include some contracts signed in October, so there is a significant lag to this data.
The MoM increase in the seasonally adjusted Case-Shiller National Index was at 0.16%. This increase followed seven consecutive MoM decreases.
On a seasonally adjusted basis, prices declined in 11 of 20 Case-Shiller cities on a month-to-month basis. The largest monthly declines seasonally adjusted were in Seattle (-1.5%), Las Vegas (-0.9%), and Portland (-0.4%). Seasonally adjusted, San Francisco has fallen 13.5% from the peak in May 2022 and Seattle is down 12.8% from the peak. All 20 cities have seen price declines from the recent peak (SA).

There is much more in the article. You can subscribe at https://calculatedrisk.substack.com/
Case-Shiller: National House Price Index "Declines Moderated" to 2.0% year-over-year increase in February
by Calculated Risk on 4/25/2023 09:15:00 AM
S&P/Case-Shiller released the monthly Home Price Indices for February ("February" is a 3-month average of December, January and February closing prices).
This release includes prices for 20 individual cities, two composite indices (for 10 cities and 20 cities) and the monthly National index.
From S&P: S&P Corelogic Case-Shiller Index Declines Moderated in February
The S&P CoreLogic Case-Shiller U.S. National Home Price NSA Index, covering all nine U.S. census divisions, reported a 2.0% annual gain in February, down from 3.7% in the previous month. The 10-City Composite annual increase came in at 0.4%, down from 2.5% in the previous month. The 20-City Composite posted a 0.4% year-over-year gain, down from 2.6% in the previous month.
Miami, Tampa, and Atlanta again reported the highest year-over-year gains among the 20 cities in February. The order remained the same with Miami leading the way with a 10.8% year-over-year price increase, followed by Tampa in second with a 7.7% increase, and Atlanta in third with a 6.6% increase. All 20 cities reported lower prices in the year ending February 2023 versus the year ending January 2023.
...
Before seasonal adjustment, the U.S. National Index posted a 0.2% month-over-month increase in February, while the 10-City and 20-City Composites posted increases of 0.3% and 0.2%, respectively.
After seasonal adjustment, the U.S. National Index posted a month-over-month increase of 0.2%, while both the 10-City and 20-City Composites posted increases of 0.1%.
In January, before seasonal adjustment, 19 cities reported declines with only Miami reporting an increase at 0.1%. After seasonal adjustment, 15 cities reported declines while Miami, Boston, Charlotte, and Cleveland had slight increases.
“Home price trends moderated in February 2023,” says Craig J. Lazzara, Managing Director at S&P DJI. “The National Composite, which had declined for seven consecutive months, rose a modest 0.2% in February, and now stands 4.9% below its June 2022 peak. Our 10- and 20-City Composites performed similarly, with February gains of 0.3% and 0.2%; these Composites are currently 6.0% and 6.6% below their respective peaks. On a trailing 12-month basis, the National Composite is only 2.0% above its level in February 2022; the 10- and 20-City Composites are both up 0.4% on a year-over-year basis."
emphasis added
 Click on graph for larger image.
 The first graph shows the nominal seasonally adjusted Composite 10, Composite 20 and National indices (the Composite 20 was started in January 2000).
The Composite 10 index is up 0.1% in February (SA) and down 4.3% from the recent peak in June 2022.
The Composite 20 index is up 0.1% (SA) in February and down 4.6% from the recent peak in June 2022.
The National index is up 0.2% (SA) in February and is down 2.8% from the peak in June 2022.
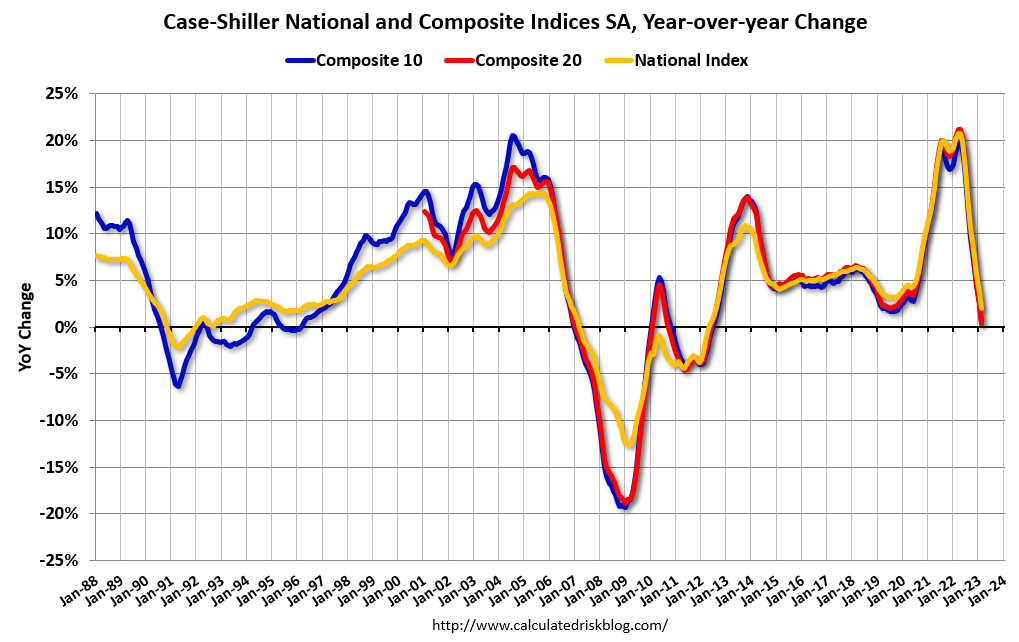 The second graph shows the year-over-year change in all three indices.
The Composite 10 SA is up 0.4% year-over-year. The Composite 20 SA is up 0.4% year-over-year.
The National index SA is up 2.0% year-over-year.
Annual price increases were below expectations. I'll have more later.
Monday, April 24, 2023
Tuesday: New Home Sales, Case-Shiller House Prices
by Calculated Risk on 4/24/2023 09:00:00 PM
 From Matthew Graham at Mortgage News Daily: Mortgage Rates Slightly Lower to Start The Week
The average lender moved slightly lower in cost. The change was small enough that most borrowers will see it in the form of a modest reduction in upfront costs without any change in the quoted interest rate (relative to what the same scenario would have been quoted on Friday). [30 year fixed 6.59%]Tuesday:
emphasis added
• At 9:00 AM ET, S&P/Case-Shiller House Price Index for February. The consensus is for a 2.5% year-over-year increase in the Comp 20 index for February.
• Also at 9:00 AM, FHFA House Price Index for February. This was originally a GSE only repeat sales, however there is also an expanded index.
• At 10:00 AM, New Home Sales for March from the Census Bureau. The consensus is for 630 thousand SAAR, down from 640 thousand in February.
• At 10:00 AM, Richmond Fed Survey of Manufacturing Activity for April.
Vehicle Sales Forecast: "April U.S. Light-Vehicle Sales to Post Strong Growth"
by Calculated Risk on 4/24/2023 04:27:00 PM
From WardsAuto: April U.S. Light-Vehicle Sales to Post Strong Growth; Inventory to Fall from March (pay content). Brief excerpt:
Even though the seasonally adjusted annual rate could decline slightly from the prior quarter’s 15.2 million units, sales volume is forecast to rise a robust 13% year-over-year in Q2. Inventory will undergo a seasonally related month-to-month decline in April but resume growth by the end of the quarter.
emphasis added
 Click on graph for larger image.
This graph shows actual sales from the BEA (Blue), and Wards forecast for April (Red).
The Wards forecast of 15.5 million SAAR, would be up 4.6% from last month, and up 8.5% from a year ago.
Vehicle sales are usually a transmission mechanism for Federal Open Market Committee (FOMC) policy, although far behind housing. This time vehicle sales were more suppressed by supply chain issues and have picked up recently.
Final Look at Local Housing Markets in March
by Calculated Risk on 4/24/2023 09:56:00 AM
Today, in the Calculated Risk Real Estate Newsletter: Final Look at Local Housing Markets in February
A brief excerpt:
Every month I track about 40 local housing markets in the US to get an early sense of changes in the housing market. After the National Association of Realtors® (NAR) releases the monthly existing home sales report, I pick up additional local market data that is reported after the NAR (and I’m frequently adding more markets). This is the final look at local markets in March.There is much more in the article. You can subscribe at https://calculatedrisk.substack.com/
The big story for March existing home sales was the sharp year-over-year (YoY) decline in sales. Also, active inventory increased YoY, but is still historically low - and new listings were down YoY.
First, here is a table comparing the year-over-year Not Seasonally Adjusted (NSA) declines in sales this year from the National Association of Realtors® (NAR) with the local markets I track. So far, these measures have tracked closely. The NAR reported sales were down 23.0% NSA YoY in February.
...
Note: Even if existing home sales activity bottomed in December (4.03 million SA) and January (4.00 million SA), there are usually two bottoms for housing - the first for activity and the second for prices. See Has Housing "Bottomed"?
My early expectation is we will see a somewhat similar YoY sales decline NSA in April as in March. Even though mortgage rates were higher for contracts signed in March (closed sales in April will be mostly for contracts signed in February and March) sales were already declining in March 2022, as 30-year mortgage rates moved above 4% for the first time since early 2019 (yes, rates were below 4% prior to the pandemic).
More local data coming in May for activity in April!

Housing April 24th Weekly Update: Inventory Increased 2.1% Week-over-week
by Calculated Risk on 4/24/2023 08:30:00 AM
Altos reports that active single-family inventory was up 2.1% week-over-week. Maybe inventory has finally bottomed seasonally. This is the highest inventory level since the week ending March 17th.
 Click on graph for larger image.
This inventory graph is courtesy of Altos Research.
As of April 21st, inventory was at 414 thousand (7-day average), compared to 405 thousand the prior week.
Year-to-date, inventory is down 15.6%.

The red line is for 2023. The black line is for 2019. Note that inventory is up from the previous two years (the record low was in 2022), but still well below normal levels.
Inventory was up 52.5% compared to the same week in 2022 (last week it was up 51.6%), and down 52.1% compared to the same week in 2019 (last week down 52.4%).
A key will be when inventory starts increasing in 2023 - maybe this is the beginning. If this is the seasonal bottom, it is late in the year (similar timing as 2021).
Mike Simonsen discusses this data regularly on Youtube.
Sunday, April 23, 2023
Sunday Night Futures
by Calculated Risk on 4/23/2023 06:43:00 PM
Weekend:
• Schedule for Week of April 23, 2023
Monday:
• At 8:30 AM ET, Chicago Fed National Activity Index for March. This is a composite index of other data.
• At 10:30 AM, Dallas Fed Survey of Manufacturing Activity for April.
From CNBC: Pre-Market Data and Bloomberg futures S&P 500 are down 6 and DOW futures are down 44 (fair value).
Oil prices were down over the last week with WTI futures at $77.87 per barrel and Brent at $81.66 per barrel. A year ago, WTI was at $103, and Brent was at $105 - so WTI oil prices are down about 24% year-over-year.
Here is a graph from Gasbuddy.com for nationwide gasoline prices. Nationally prices are at $3.64 per gallon. A year ago, prices were at $4.09 per gallon, so gasoline prices are down $0.45 per gallon year-over-year.
The Normal Seasonal Pattern for Median House Prices
by Calculated Risk on 4/23/2023 10:37:00 AM
Last week, in the CalculatedRisk Real Estate Newsletter on March existing home sales, NAR: Existing-Home Sales Decreased to 4.44 million SAAR in March; Median Prices Declined 0.9% YoY, I noted that median prices were down year-over-year (median prices are distorted by the mix).
Seasonally prices typically peak in June (closed sales are mostly for contracts signed in April and May).
And seasonally prices usually bottom the following January (contracts signed in November and December).
The recent surge in prices started mid-year 2020 and ran through Q1 2022 when mortgage rates started increasing significantly.
The 2023 increase in median prices from January to March was about the same as in 2018 and 2019.
Here is a table of the seasonal percentage increases from January to March, and from March to June (the usual seasonal peak) over the last several years. The third row is the total percentage increase from January to June.
The last row shows the seasonal decline from June to December. Note: In 2019, prices only declined 3.8% in the 2nd half of the year as mortgage rates declined into the mid-3s (pre-pandemic low was 3.5% on a 30-year mortgage according to Freddie MAC PMMS).
In 2020, prices continued to increase in the 2nd half of the year and didn't peak seasonally until October. And prices only declined slightly in the 2nd half of 2021.
| 2018 | 2019 | 2020 | 2021 | 2022 | 2023 | |
|---|---|---|---|---|---|---|
| Jan to Mar | 3.7% | 4.1% | 5.4% | 7.5% | 7.1% | 4.0% |
| Mar to Jun | 9.6% | 9.9% | 4.9% | 12.4% | 9.1% | NA |
| Total Jan to Jun | 13.7% | 14.4% | 10.6% | 20.8% | 16.8% | NA |
| Jun to Dec | -7.0% | -3.8% | 5.0% | -2.2% | -11.4% | NA |
The 2023 increase in median prices from January to March was about the same as in 2018 and 2019.
Normally we'd expect median prices to increase 9% to 10% over the next three months, before declining in the 2nd half of the year. The seasonal pattern will be interesting this year.
Saturday, April 22, 2023
Real Estate Newsletter Articles this Week: "Most Multi-family Under Construction Since 1973"
by Calculated Risk on 4/22/2023 02:11:00 PM
At the Calculated Risk Real Estate Newsletter this week:
• NAR: Existing-Home Sales Decreased to 4.44 million SAAR in March; Median Prices Declined 0.9% YoY
• March Housing Starts: Most Multi-family Under Construction Since 1973
• Lawler on Demographics: New Population Estimates Incorporate Unprecedented Methodological Changes
• Why Measures of Existing Home Inventory appear Different
• 4th Look at Local Housing Markets: California Home Sales down 34% YoY in March; Prices Down 7.0% YoY
This is usually published 4 to 6 times a week and provides more in-depth analysis of the housing market.
You can subscribe at https://calculatedrisk.substack.com/
Most content is available for free (and no Ads), but please subscribe!
Schedule for Week of April 23, 2023
by Calculated Risk on 4/22/2023 08:11:00 AM
The key reports scheduled for this week are the advance estimate of Q1 GDP and March New Home sales.
Other key reports include February Case-Shiller house prices and Personal Income and Outlays for March.
For manufacturing, the April Dallas, Richmond and Kansas City manufacturing surveys will be released.
8:30 AM ET: Chicago Fed National Activity Index for March. This is a composite index of other data.
10:30 AM: Dallas Fed Survey of Manufacturing Activity for April.
 9:00 AM: S&P/Case-Shiller House Price Index for February.
This graph shows the nominal seasonally adjusted National Index, Composite 10 and Composite 20 indexes through the most recent report (the Composite 20 was started in January 2000).
The consensus is for a 2.5% year-over-year increase in the Comp 20 index for February.
9:00 AM: FHFA House Price Index for February. This was originally a GSE only repeat sales, however there is also an expanded index.
 10:00 AM: New Home Sales for March from the Census Bureau.
 This graph shows New Home Sales since 1963. The dashed line is the sales rate for last month.
The consensus is for 630 thousand SAAR, down from 640 thousand in February.
10:00 AM: Richmond Fed Survey of Manufacturing Activity for April.
7:00 AM ET: The Mortgage Bankers Association (MBA) will release the results for the mortgage purchase applications index.
8:30 AM: Durable Goods Orders for March from the Census Bureau. The consensus is for a 0.9% increase in durable goods orders.
8:30 AM: The initial weekly unemployment claims report will be released. The consensus is for 250 thousand initial claims, up from 245 thousand last week.
8:30 AM: Gross Domestic Product, 1st quarter 2023 (Advance estimate). The consensus is that real GDP increased 2.0% annualized in Q1, down from 2.6% in Q4.
10:00 AM: Pending Home Sales Index for March. The consensus is for a 1.0% increase in the index.
11:00 AM: the Kansas City Fed manufacturing survey for April. This is the last of regional manufacturing surveys for April.
8:30 AM ET: Personal Income and Outlays, March 2023. The consensus is for a 0.2% increase in personal income, and for a 0.1% decrease in personal spending. And for the Core PCE price index to increase 0.3%. PCE prices are expected to be up 4.1% YoY, and core PCE prices up 4.5% YoY.
9:45 AM: Chicago Purchasing Managers Index for April. The consensus is for a reading of 43.5, down from 43.8 in March.
10:00 AM: University of Michigan's Consumer sentiment index (Final for April). The consensus is for a reading of 63.5.
Friday, April 21, 2023
COVID Apr 21, 2023: Update on Cases, Hospitalizations and Deaths
by Calculated Risk on 4/21/2023 09:00:00 PM
 Note: Mortgage rates are from MortgageNewsDaily.com and are for top tier scenarios.
On COVID (focus on hospitalizations and deaths). Data is now weekly.
After the first few weeks, the pandemic low for weekly deaths had been the week of July 7, 2021, at 1,690 deaths (until recently).
For cases, the low was 82,186 (getting close).
For COVID hospitalizations, the low was 9,821 (also getting close).
| COVID Metrics | ||||
|---|---|---|---|---|
| Now | Week Ago | Goal | ||
| New Cases per Week2 | 94,142 | 101,598 | ≤35,0001 | |
| Hospitalized2 | 11,097 | 12,418 | ≤3,0001 | |
| Deaths per Week2 | 1,160 | 1,333 | ≤3501 | |
| 1my goals to stop weekly posts, 2Weekly for Cases, Currently Hospitalized, and Deaths 🚩 Increasing number weekly for Cases, Hospitalized, and Deaths ✅ Goal met. | ||||
 Click on graph for larger image.
This graph shows the weekly (columns) number of deaths reported.
Weekly deaths decreased this week and set a new pandemic low of 1,160 deaths in the most recent week.
Q1 GDP Tracking: Around 2%
by Calculated Risk on 4/21/2023 01:31:00 PM
The advance estimate of Q1 GDP will be released this coming Thursday, April 27th. The consensus is that real GDP increased 2.0% annualized in Q1, down from 2.6% in Q4.
From BofA:
On net, the data lowered our tracking estimate a tenth to 1.5% q/q saar. ... Our tracking estimate for personal consumption expenditures (PCE) increased from 3.5% q/q saar to 4.0% q/q saar owing to slightly stronger than expected retail sales and a surge in utitilities production. [Apr 21st estimate]From Goldman:
emphasis added
We have left our Q1 GDP tracking estimate unchanged at +2.2% (qoq ar). Our domestic final sales growth forecast stands at +3.9%. [Apr 20th estimate]And from the Altanta Fed: GDPNow
The GDPNow model estimate for real GDP growth (seasonally adjusted annual rate) in the first quarter of 2023 is 2.5 percent on April 18, unchanged from April 14 after rounding. After this morning's housing starts report from the US Census Bureau, the nowcast of first-quarter real residential investment growth increased from -5.8 percent to -5.5 percent. [Apr 18th estimate]
Why Measures of Existing Home Inventory appear Different
by Calculated Risk on 4/21/2023 09:57:00 AM
Today, in the Calculated Risk Real Estate Newsletter: Why Measures of Existing Home Inventory appear Different
A brief excerpt:
Here is a graph comparing the year-over-year change in Realtor.com’s active inventory, the NAR’s inventory, and Realtor.com inventory including pending sales. Note that the blue line (NAR) and dashed black line (Realtor including pending sales) track.There is much more in the article. You can subscribe at https://calculatedrisk.substack.com/
As Lawler noted, including pending sales understated the decline in active inventory in 2020 and 2021, and is now understating the increase in active inventory.
But what about Redfin? Redfin takes a very different approach. Their active inventory number for any month includes homes that came on the market and sold quickly during the month, whereas the other measures are a snapshot at the end of the month (or week).

Black Knight: "Mortgage Delinquencies Hit Record Low in March"
by Calculated Risk on 4/21/2023 08:30:00 AM
From Black Knight: Black Knight’s First Look: Mortgage Delinquencies Hit Record Low in March, While Prepayments Rose on Easing Rates and Seasonal Tailwinds
• The national delinquency rate dropped 53 basis points (-15%) in March, falling below 3% for the first time on record, ending the month at just 2.92%According to Black Knight's First Look report, the percent of loans delinquent decreased 15% in March compared to February and decreased 13% year-over-year.
• While delinquency rates almost always fall in March – as borrowers utilize tax refunds and other seasonal revenues to pay down past-due debt – the drop marked the second largest decline in the past 17 years
• Factoring in March’s decline, the total number of past-due mortgages (including active foreclosures) has fallen to its lowest level in nearly 23 years, dating all the way back to April 2000
• Serious delinquencies (90+ days past due) showed marked improvement, falling by 51K to their lowest level since March 2020, with volumes shrinking in every state
• Likewise, every state saw overall delinquencies fall in March, with improvements ranging from 11.9% in Washington to 21.5% in Vermont
• Both foreclosure starts (+9.0%) and sales (+4.6%) rose in the month but still remain well below pre-pandemic volumes at the national level
• Active foreclosure inventory held steady, but remains 31K (12%) below March 2020 levels
• The prepayment rate (SMM) rose to 0.50% (+44% month over month) driven, as anticipated, by seasonal tailwinds in sale-related prepayments and an increased demand for refis due to falling rates
emphasis added
Black Knight reported the U.S. mortgage delinquency rate (loans 30 or more days past due, but not in foreclosure) was 2.92% in March, down from 3.45% the previous month.
The percent of loans in the foreclosure process was essentially unchanged in March at 0.46%, from 0.46% the previous month.
The number of delinquent properties, but not in foreclosure, is down 209,000 properties year-over-year, and the number of properties in the foreclosure process is up 31,000 properties year-over-year.
| Black Knight: Percent Loans Delinquent and in Foreclosure Process | ||||
|---|---|---|---|---|
| Mar 2023 | Feb 2023 | |||
| Delinquent | 2.92% | 3.45% | ||
| In Foreclosure | 0.46% | 0.46% | ||
| Number of properties: | ||||
| Number of properties that are delinquent, but not in foreclosure: | 1,539,000 | 1,811,000 | ||
| Number of properties in foreclosure pre-sale inventory: | 240,000 | 240,000 | ||
| Total Properties | 1,779,000 | 2,050,000 | ||
Thursday, April 20, 2023
Hotels: Occupancy Rate Up 3.7% Year-over-year
by Calculated Risk on 4/20/2023 03:39:00 PM
U.S. hotel performance increased from the previous week, according to STR‘s latest data through April 15.The following graph shows the seasonal pattern for the hotel occupancy rate using the four-week average.
April 9-15, 2023 (percentage change from comparable week in 2022):
• Occupancy: 64.2% (+3.7%)
• Average daily rate (ADR): $155.33 (+4.7%)
• Revenue per available room (RevPAR): $99.67 (+8.6%)
emphasis added
 Click on graph for larger image.
The red line is for 2023, black is 2020, blue is the median, and dashed light blue is for 2022. Dashed purple is for 2018, the record year for hotel occupancy.
The 4-week average of the occupancy rate is close to the median rate for the period 2000 through 2020 (Blue).
Note: Y-axis doesn't start at zero to better show the seasonal change.
The 4-week average of the occupancy rate will move more sideways until the summer travel season.
Realtor.com Reports Weekly Active Inventory Up 49% YoY; New Listings Down 5% YoY
by Calculated Risk on 4/20/2023 01:32:00 PM
Realtor.com has monthly and weekly data on the existing home market. Here is their weekly report released today from chief economist Danielle Hale: Weekly Housing Trends View — Data Week Ending Apr 15, 2023
• Active inventory growth continued to climb, with for-sale homes up 49% above one year ago. The number of homeowners shifting home listing timelines around spring holidays helped push active inventory growth up this week. Despite the big surge, the number of homes for-sale continues to trail pre-pandemic levels, keeping many cards in the hands of sellers sitting on very high levels of home equity.
...
• New listings–a measure of sellers putting homes up for sale–were down again this week, but only by 5% from one year ago. The number of newly listed homes has been lower than the same time the previous year for the past 41 weeks and while this week continued that trend, the magnitude shifted in a big way. Shifts in religious holidays that fell earlier in 2023 are likely responsible for last week’s big drop and this week’s significantly smaller decline. On average across the two weeks, the decline in new listings is roughly on track with what we’ve seen so far this year.
 Here is a graph of the year-over-year change in inventory according to realtor.com.
 Inventory is still up year-over-year - from record lows - however, the YoY increase has slowed recently, although this was a pickup from up 44% YoY last week.


