 RSS Feed
 by Calculated Risk on 2/18/2022 10:15:00 AM
Friday, February 18, 2022
NAR: Existing-Home Sales Increased to 6.50 million SAAR in January
From the NAR: Existing-Home Sales Surge 6.7% in January
Existing-home sales rose in January, making a notable move upward following a previous month where sales declined, according to the National Association of Realtors®. On a month-over-month basis, each of the four major U.S. regions experienced an increase in sales in January. However, year-over-year, activity was mixed as two regions reported sagging sales, another watched sales increase and a fourth region remained flat.
Total existing-home sales, completed transactions that include single-family homes, townhomes, condominiums and co-ops, climbed 6.7% from December to a seasonally adjusted annual rate of 6.50 million in January. Year-over-year, sales fell 2.3% (6.65 million in January 2021).
...
Total housing inventory at the end of January amounted to 860,000 units, down 2.3% from December and down 16.5% from one year ago (1.03 million). Unsold inventory sits at a 1.6-month supply at the current sales pace, down from 1.7 months in December and from 1.9 months in January 2021.
emphasis added
 Click on graph for larger image.
This graph shows existing home sales, on a Seasonally Adjusted Annual Rate (SAAR) basis since 1993.
Sales in January (6.50 million SAAR) were up 6.7% from last month and were 2.3% below the January 2021 sales rate.
The second graph shows nationwide inventory for existing homes.
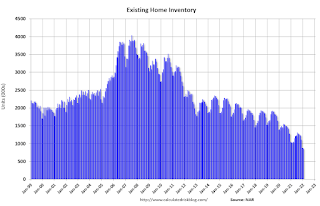 According to the NAR, inventory decreased to 0.86 million in January from 0.88 million in December.
Headline inventory is not seasonally adjusted, and inventory usually decreases to the seasonal lows in December and January, and peaks in mid-to-late summer.
The last graph shows the year-over-year (YoY) change in reported existing home inventory and months-of-supply. Since inventory is not seasonally adjusted, it really helps to look at the YoY change. Note: Months-of-supply is based on the seasonally adjusted sales and not seasonally adjusted inventory.
 Inventory was down 16.5% year-over-year in January compared to January 2021.
Months of supply declined to 1.6 months in January from 1.7 months in December.
This was above the consensus forecast. I'll have more later.
The last graph shows the year-over-year (YoY) change in reported existing home inventory and months-of-supply. Since inventory is not seasonally adjusted, it really helps to look at the YoY change. Note: Months-of-supply is based on the seasonally adjusted sales and not seasonally adjusted inventory.
Inventory was down 16.5% year-over-year in January compared to January 2021. Months of supply declined to 1.6 months in January from 1.7 months in December.
This was above the consensus forecast. I'll have more later.


