 RSS Feed
 by Calculated Risk on 2/18/2022 08:30:00 AM
Friday, February 18, 2022
LA Area Port Traffic: Record Inbound Traffic for January
Notes: The expansion to the Panama Canal was completed in 2016 (As I noted a few years ago), and some of the traffic that used the ports of Los Angeles and Long Beach is probably going through the canal. This might be impacting TEUs on the West Coast.
Also, incoming port traffic is still backed up in the LA area.
Container traffic gives us an idea about the volume of goods being exported and imported - and usually some hints about the trade report since LA area ports handle about 40% of the nation's container port traffic.
The following graphs are for inbound and outbound traffic at the ports of Los Angeles and Long Beach in TEUs (TEUs: 20-foot equivalent units or 20-foot-long cargo container).
To remove the strong seasonal component for inbound traffic, the first graph shows the rolling 12-month average.
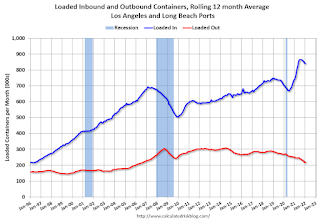
On a rolling 12-month basis, inbound traffic was up 0.1% in January compared to the rolling 12 months ending in December. Outbound traffic was down 0.5% compared to the rolling 12 months ending the previous month.
The 2nd graph is the monthly data (with a strong seasonal pattern for imports).

It seems likely there won't be a dip in February and March this year (like last year) with ships still backed up waiting to unload.
Imports were up 2% YoY in January, and exports were down 5% YoY.
This was a record for inbound traffic for January.


