 RSS Feed
 by Calculated Risk on 1/11/2022 10:11:00 AM
Tuesday, January 11, 2022
Missing Workers by Age Group
Note: This is an update to an earlier post.
In November, Goldman Sachs economists put out a research note on the labor force participation rate: Why Isn’t Labor Force Participation Recovering?
Here are few excerpts from the note:
 Click on graph for larger image.
This data is comparing December 2021 to December 2019, using Not Seasonally Adjusted (NSA) data (I compared to December 2019 to minimize the seasonal impact when using NSA data).
While the unemployment rate continues to fall quickly, labor force participation has made no progress since August 2020. ... Most of the 5.0mn persons who have exited the labor force since the start of the pandemic are over age 55 (3.4mn), largely reflecting early (1.5mn) and natural (1mn) retirements that likely won’t reverse. The outlook for prime-age persons who have exited the labor force (1.7mn) is more positive, since very few are discouraged and most still view their exits as temporary.
First, there are two important monthly surveys from the BLS. The participation rate (and unemployment rate) comes from the Current Population Survey (CPS: commonly called the household survey), a monthly survey of about 60,000 households.
The jobs number comes from Current Employment Statistics (CES: payroll survey), a sample of approximately 634,000 business establishments nationwide.
These are very different surveys: the CPS gives the total number of employed (and unemployed including the alternative measures), and the CES gives the total number of positions (excluding some categories like the self-employed, and a person working two jobs counts as two positions).
Currently the payroll survey shows there are 3.6 million fewer jobs than in February 2020 (pre-pandemic).
The household survey shows there are 2.9 million fewer people employed than in February 2020.
Note: The 5 million number for the labor force, probably assumes some normal labor force growth; however, overall population growth has been dismal over the last 2 years (little immigration and large number of deaths). I'm not confident in Goldman's 5-million-person estimate.
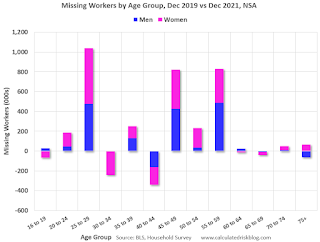
Here is a graph of the number of missing people by age group (from the CPS household survey).
Click on graph for larger image.This data is comparing December 2021 to December 2019, using Not Seasonally Adjusted (NSA) data (I compared to December 2019 to minimize the seasonal impact when using NSA data).
Positive numbers are missing workers.
Almost all of the missing employed workers - by this method - are in the 25 to 29, 45 to 49, and in the 55 to 59 age groups.
Note: this is over a 2-year period, and there have been some demographic shifts between cohorts.
This data would suggest most of the missing workers are prime age or took early retirement (the missing workers in their '50s).


