by Calculated Risk on 9/30/2020 09:42:00 PM
Wednesday, September 30, 2020
Thursday: Unemployment Claims, Personal Income and Outlays, ISM Mfg, Construction Spending, Vehicle Sales
Thursday:
• At 8:30 AM ET, The initial weekly unemployment claims report will be released. Initial claims were 870 thousand the previous week.
• Also at 8:30 AM, Personal Income and Outlays for August. The consensus is for a 2.2% decrease in personal income, and for a 0.7% increase in personal spending. And for the Core PCE price index to increase 0.3%.
• At 10:00 AM, ISM Manufacturing Index for September. The consensus is for a reading of 56.2, up from 56.0 in August.
• Also at 10:00 AM, Construction Spending for August. The consensus is for a 0.7% increase.
• All day: Light vehicle sales for September. The consensus is for sales of 16.2 million SAAR, up from 15.2 million SAAR in August (Seasonally Adjusted Annual Rate).
September 30 COVID-19 Test Results
by Calculated Risk on 9/30/2020 07:32:00 PM
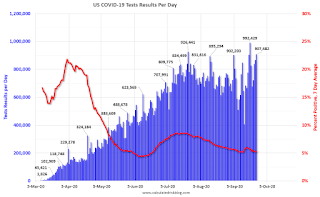
The US is now mostly reporting 700 thousand to 1 million tests per day. Based on the experience of other countries, the percent positive needs to be well under 5% to really push down new infections (probably close to 1%), so the US still needs to increase the number of tests per day significantly (or take actions to push down the number of new infections).
There were 715,182 test results reported over the last 24 hours.
There were 44,391 positive tests.
Over 23,000 Americans died from COVID in September. See the graph on US Daily Deaths here.

This data is from the COVID Tracking Project.
The percent positive over the last 24 hours was 6.2% (red line is 7 day average).
For the status of contact tracing by state, check out testandtrace.com.
And check out COVID Exit Strategy to see how each state is doing.
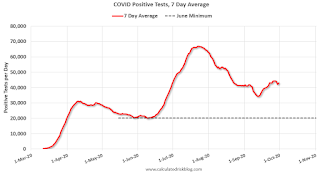
The dashed line is the June low.
Note that there were very few tests available in March and April, and many cases were missed (the percent positive was very high - see first graph). By June, the percent positive had dropped below 5%.
If people stay vigilant, the number of cases might drop to the June low towards the end of October (that would still be a large number of new cases, but progress).
Fannie Mae: Mortgage Serious Delinquency Rate Increased in August
by Calculated Risk on 9/30/2020 04:18:00 PM
Fannie Mae reported that the Single-Family Serious Delinquency increased to 3.32% in August, from 3.24% in July. The serious delinquency rate is up from 0.67% in August 2019.
This is the highest serious delinquency rate since October 2012.
These are mortgage loans that are "three monthly payments or more past due or in foreclosure".
The Fannie Mae serious delinquency rate peaked in February 2010 at 5.59%.

By vintage, for loans made in 2004 or earlier (2% of portfolio), 5.79% are seriously delinquent (up from 5.57% in July). For loans made in 2005 through 2008 (3% of portfolio), 9.74% are seriously delinquent (up from 9.36%), For recent loans, originated in 2009 through 2018 (95% of portfolio), 2.86% are seriously delinquent (up from 2.79%). So Fannie is still working through a few poor performing loans from the bubble years.
Mortgages in forbearance are counted as delinquent in this monthly report, but they will not be reported to the credit bureaus.
This is very different from the increase in delinquencies following the housing bubble. Lending standards have been fairly solid over the last decade, and most of these homeowners have equity in their homes - and they will be able to restructure their loans once they are employed.
Note: Freddie Mac reported earlier.
Las Vegas Visitor Authority: No Convention Attendance, Visitor Traffic Down 57% YoY in August
by Calculated Risk on 9/30/2020 03:14:00 PM
From the Las Vegas Visitor Authority: August 2020 Las Vegas Visitor Statistics
With gradually more rooms opening and increased volume on weekends, the destination hosted over 1.5M visitors in August, down -57% from last year but up 6.9% from last month.Here is the data from the Las Vegas Convention and Visitors Authority.
The convention segment continued to register minimal measurable volume with continued mandated restrictions on group sizes.
With open properties representing an inventory of 127,657 rooms*, total occupancy reached 42.7% for the month as weekend occupancy improved to 63.1% while midweek occupancy reached 34.4%.
* Reflects weighted average of daily room tallies
 Click on graph for larger image.
 The blue and red bars are monthly visitor traffic (left scale) for 2019 and 2020. The dashed blue and orange lines are convention attendance (right scale).
Convention traffic in August was down 100% compared to July 2019.
And visitor traffic was down 57% YoY.
The casinos started to reopen on June 4th (it appears about 85% of rooms have now opened).
NAR: Pending Home Sales Increase 8.8% in August
by Calculated Risk on 9/30/2020 10:03:00 AM
From the NAR: Pending Home Sales Index Reaches Record High as Sales Ascend 8.8% in August
The Pending Home Sales Index (PHSI), a forward-looking indicator of home sales based on contract signings, rose 8.8% to 132.8 – a record high – in August. Year-over-year, contract signings rose 24.2%. An index of 100 is equal to the level of contract activity in 2001.This was above expectations for this index. Note: Contract signings usually lead sales by about 45 to 60 days, so this would usually be for closed sales in September and October.
...
The Northeast PHSI grew 4.3% to 117.1 in August, a 26.0% jump from a year ago. In the Midwest, the index rose 8.6% to 124.5 last month, up 25.0% from August 2019.
Pending home sales in the South increased 8.6% to an index of 154.2 in August, up 23.6% from August 2019. The index in the West rose 13.1% in August to 120.3, up 23.6% from a year ago.
emphasis added
Q2 GDP Revised up to -31.4% Annual Rate
by Calculated Risk on 9/30/2020 08:34:00 AM
From the BEA: Gross Domestic Product (Third Estimate), Corporate Profits (Revised), and GDP by Industry (Annual Update), Second Quarter 2020
Real gross domestic product (GDP) decreased at an annual rate of 31.4 percent in the second quarter of 2020, according to the "third" estimate released by the Bureau of Economic Analysis. In the first quarter, real GDP decreased 5.0 percent.From the BEA revision information, here is a Comparison of Third and Second Estimates. PCE growth was revised up to -33.2% from -34.6%. Residential investment was revised up from -37.9% to -35.6%. This was close to the consensus forecast.
The “third” estimate of GDP released today is based on more complete source data than were available for the "second" estimate issued last month. In the second estimate, the decrease in real GDP was 31.7 percent. The upward revision with the third estimate primarily reflected an upward revision to personal consumption expenditures (PCE) that was partly offset by downward revisions to exports and to nonresidential fixed investment.
emphasis added
ADP: Private Employment increased 749,000 in September
by Calculated Risk on 9/30/2020 08:19:00 AM
Private sector employment increased by 749,000 jobs from August to September according to the September ADP National Employment Report®. ... The report, which is derived from ADP’s actual payroll data, measures the change in total nonfarm private employment each month on a seasonally-adjusted basis.This was above the consensus forecast for 605 thousand private sector jobs added in the ADP report.
“The labor market continues to recover gradually,” said Ahu Yildirmaz, vice president and co-head of the ADP Research Institute. “In September, the majority of sectors and company sizes experienced gains with trade, transportation and utilities; and manufacturing leading the way. However, small businesses continued to demonstrate slower growth.
emphasis added
The BLS report will be released Friday, and the consensus is for 850 thousand non-farm payroll jobs added in September. Of course the ADP report has not been very useful in predicting the BLS report.
MBA: Mortgage Applications Decrease in Latest Weekly Survey
by Calculated Risk on 9/30/2020 07:00:00 AM
From the MBA: Mortgage Applications Decrease in Latest MBA Weekly Survey
Mortgage applications decreased 4.8 percent from one week earlier, according to data from the Mortgage Bankers Association’s (MBA) Weekly Mortgage Applications Survey for the week ending September 25, 2020.
... The Refinance Index decreased 7 percent from the previous week and was 52 percent higher than the same week one year ago. The seasonally adjusted Purchase Index decreased 2 percent from one week earlier. The unadjusted Purchase Index decreased 2 percent compared with the previous week and was 22 percent higher than the same week one year ago.
“Mortgage rates decreased last week, with the 30-year fixed rate mortgage declining 5 basis points to 3.05 percent – the lowest in MBA’s survey. Despite the decline in rates, refinances fell over 6 percent, driven by a 9 percent drop in conventional refinance applications,” said Joel Kan, MBA’s Associate Vice President of Economic and Industry Forecasting. “There are indications that refinance rates are not decreasing to the same extent as rates for home purchase loans, and that could explain last week’s decline in refinances. Many lenders are still operating at full capacity and working through operational challenges, ultimately limiting the number of applications they are able to accept.”
Added Kan, “Purchase applications also decreased last week, but activity was still at a strong year-overyear growth rate of 22 percent. Even as pent-up demand from earlier in the year wanes, there continues to be action in the higher price tiers, with the average loan balance remaining close to an all-time survey high.”
...
The average contract interest rate for 30-year fixed-rate mortgages with conforming loan balances ($510,400 or less) decreased to 3.05 percent from 3.10 percent, with points increasing to 0.52 from 0.46 (including the origination fee) for 80 percent loan-to-value ratio (LTV) loans.
emphasis added
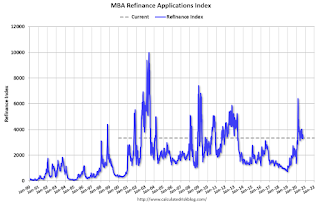 Click on graph for larger image.
The first graph shows the refinance index since 1990.
The refinance index has been very volatile recently depending on rates and liquidity.
But with record low rates, the index is up significantly from last year.
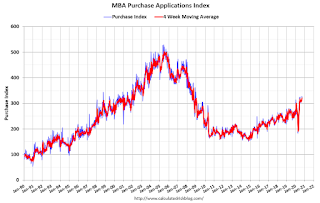 The second graph shows the MBA mortgage purchase index
According to the MBA, purchase activity is up 22% year-over-year unadjusted.
Note: Red is a four-week average (blue is weekly).
Tuesday, September 29, 2020
Wednesday: ADP Employment, Q2 GDP, Chicago PMI, Pending Home Sales
by Calculated Risk on 9/29/2020 09:24:00 PM
Wednesday:
• At 7:00 AM ET, The Mortgage Bankers Association (MBA) will release the results for the mortgage purchase applications index.
• At 8:15 AM, The ADP Employment Report for September. This report is for private payrolls only (no government). The consensus is for 605,000 jobs added, up from 428,000 in August.
• At 8:30 AM, Gross Domestic Product, 2nd quarter 2020 (Third estimate). The consensus is that real GDP decreased 31.7% annualized in Q2, unchanged from the second estimate of -31.7%.
• At 9:45 AM, Chicago Purchasing Managers Index for September. The consensus is for a reading of 52.0, up from 51.2 in August.
• At 10:00 AM, Pending Home Sales Index for August. The consensus is 3.2% increase in the index.
September 29 COVID-19 Test Results
by Calculated Risk on 9/29/2020 07:14:00 PM
The US is now mostly reporting over 700,000 tests per day. Based on the experience of other countries, the percent positive needs to be well under 5% to really push down new infections, so the US still needs to increase the number of tests per day significantly (or take actions to push down the number of new infections).
There were 744,476 test results reported over the last 24 hours.
There were 36,947 positive tests.
Over 22,000 Americans have died from COVID so far in September. See the graph on US Daily Deaths here.

This data is from the COVID Tracking Project.
The percent positive over the last 24 hours was 5.0% (red line is 7 day average).
For the status of contact tracing by state, check out testandtrace.com.
And check out COVID Exit Strategy to see how each state is doing.

The dashed line is the June low.
Note that there were very few tests available in March and April, and many cases were missed (the percent positive was very high - see first graph). By June, the percent positive had dropped below 5%.
If people stay vigilant, the number of cases might drop to the June low some time in October (that would still be a large number of new cases, but progress).
Real House Prices and Price-to-Rent Ratio in July
by Calculated Risk on 9/29/2020 02:23:00 PM
Here is the post earlier on Case-Shiller: Case-Shiller: National House Price Index increased 4.8% year-over-year in July
It has been over fourteen years since the bubble peak. In the Case-Shiller release today, the seasonally adjusted National Index (SA), was reported as being 18.6% above the previous bubble peak. However, in real terms, the National index (SA) is still about 4% below the bubble peak (and historically there has been an upward slope to real house prices). The composite 20, in real terms, is still 12% below the bubble peak.
The year-over-year growth in prices increased to 4.8% nationally.
Usually people graph nominal house prices, but it is also important to look at prices in real terms (inflation adjusted). Case-Shiller and others report nominal house prices. As an example, if a house price was $200,000 in January 2000, the price would be close to $289,000 today adjusted for inflation (45%). That is why the second graph below is important - this shows "real" prices (adjusted for inflation).
Nominal House Prices
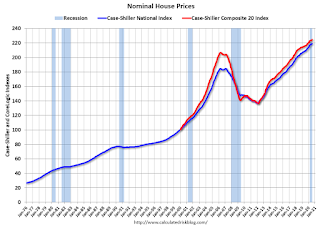
In nominal terms, the Case-Shiller National index (SA) and the Case-Shiller Composite 20 Index (SA) are both at new all times highs (above the bubble peak).
Real House Prices

In real terms, the National index is back to June 2005 levels, and the Composite 20 index is back to November 2004.
In real terms, house prices are at 2004/2005 levels.
Note that inflation was negative for a few months earlier this year, and that boosted real prices.
Price-to-Rent
In October 2004, Fed economist John Krainer and researcher Chishen Wei wrote a Fed letter on price to rent ratios: House Prices and Fundamental Value. Kainer and Wei presented a price-to-rent ratio using the OFHEO house price index and the Owners' Equivalent Rent (OER) from the BLS.

This graph shows the price to rent ratio (January 2000 = 1.0). The price-to-rent ratio has been moving sideways recently.
On a price-to-rent basis, the Case-Shiller National index is back to March 2004 levels, and the Composite 20 index is back to November 2003 levels.
In real terms, prices are back to late 2004/2005 levels, and the price-to-rent ratio is back to late 2003, early 2004.
"Chemical Activity Barometer Rises in September"
by Calculated Risk on 9/29/2020 11:12:00 AM
Note: This appears to be a leading indicator for industrial production.
From the American Chemistry Council: Chemical Activity Barometer Rises in September
The Chemical Activity Barometer (CAB), a leading economic indicator created by the American Chemistry Council (ACC), rose 1.6 percent in September on a three-month moving average (3MMA) basis following a 2.7 percent gain in August. On a year-over-year (Y/Y) basis, the barometer was down 4.3 percent in September.
The unadjusted data show a 0.7 percent gain in September following a 2.2 percent gain in August and a 1.9 percent gain in July. The diffusion index rose from 35 percent to 65 percent in September. The diffusion index marks the number of positive contributors relative to the total number of indicators monitored. The CAB reading for August was revised upward by 0.89 points and that for July was revised upward by 0.42 points.
“With five consecutive months of gains, the September CAB reading is consistent with recovery in the U.S. economy,” said Kevin Swift, chief economist at ACC.
...
Applying the CAB back to 1912, it has been shown to provide a lead of two to 14 months, with an average lead of eight months at cycle peaks as determined by the National Bureau of Economic Research. The median lead was also eight months. At business cycle troughs, the CAB leads by one to seven months, with an average lead of four months. The median lead was three months. The CAB is rebased to the average lead (in months) of an average 100 in the base year (the year 2012 was used) of a reference time series. The latter is the Federal Reserve’s Industrial Production Index.
emphasis added
 Click on graph for larger image.
This graph shows the year-over-year change in the 3-month moving average for the Chemical Activity Barometer (CAB) compared to Industrial Production.
Although the CAB (red) generally leads Industrial Production (blue), they both collapsed together with the sudden stop of the economy in March. The increases in the CAB suggest further increases in Industrial Production, but still a large year-over-year decline.
Case-Shiller: National House Price Index increased 4.8% year-over-year in July
by Calculated Risk on 9/29/2020 09:21:00 AM
S&P/Case-Shiller released the monthly Home Price Indices for July ("July" is a 3 month average of May, June and July prices).
This release includes prices for 20 individual cities, two composite indices (for 10 cities and 20 cities) and the monthly National index.
From S&P: S&P CoreLogic Case-Shiller Index Reports 4.8% Annual Home Price Gain in July
The S&P CoreLogic Case-Shiller U.S. National Home Price NSA Index, covering all nine U.S. census divisions, reported a 4.8% annual gain in July, up from 4.3% in the previous month. The 10-City Composite annual increase came in at 3.3%, up from 2.8% in the previous month. The 20-City Composite posted a 3.9% year-over-year gain, up from 3.5% in the previous month.
Phoenix, Seattle and Charlotte reported the highest year-over-year gains among the 19 cities (excluding Detroit) in July. Phoenix led the way with a 9.2% year-over-year price increase, followed by Seattle with a 7.0% increase and Charlotte with a 6.0% increase. Sixteen of the 19 cities reported higher price increases in the year ending July 2020 versus the year ending June 2020.
...
The National Index posted a 0.8% month-over-month increase, while the 10-City and 20-City Composites both posted increases of 0.6% before seasonal adjustment in July. After seasonal adjustment, the National Index posted a month-over-month increase of 0.4%, while the 10-City and 20- City Composites posted increases of 0.5% and 0.6%, respectively. In July, 18 of 19 cities (excluding Detroit) reported increases before seasonal adjustment, while 18 of the 19 cities reported increases after seasonal adjustment.
“Housing prices rose in July,” says Craig J. Lazzara, Managing Director and Global Head of Index Investment Strategy at S&P Dow Jones Indices. “The National Composite Index gained 4.8% relative to its level a year ago, slightly ahead of June’s 4.3% increase. The 10- and 20-City Composites (up 3.3% and 3.9%, respectively) also rose at an accelerating pace in July compared to June. The strength of the housing market was consistent nationally – all 19 cities for which we have July data rose, with 16 of them outpacing their June gains.
“In previous months, we’ve noted that a trend of accelerating increases in the National Composite Index began in August 2019. That trend was interrupted in May and June, as price gains decelerated modestly, but now may have resumed. Obviously more data will be required before we can say with confidence that any COVID-related deceleration is behind us.
emphasis added
 Click on graph for larger image.
 The first graph shows the nominal seasonally adjusted Composite 10, Composite 20 and National indices (the Composite 20 was started in January 2000).
The Composite 10 index is up 4.3% from the bubble peak, and up 0.5% in July (SA) from June.
The Composite 20 index is 8.7% above the bubble peak, and up 0.6% (SA) in July.
The National index is 18.6% above the bubble peak (SA), and up 0.4% (SA) in July. The National index is up 60% from the post-bubble low set in December 2011 (SA).
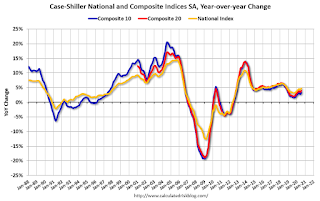 The second graph shows the Year over year change in all three indices.
The Composite 10 SA is up 3.3% compared to July 2019. The Composite 20 SA is up 4.0% year-over-year.
The National index SA is up 4.8% year-over-year.
Note: According to the data, prices increased in 18 cities month-over-month seasonally adjusted.
Price increases were slightly above expectations. I'll have more later.
Monday, September 28, 2020
Tuesday: Case-Shiller House Prices
by Calculated Risk on 9/28/2020 08:50:00 PM
Tuesday:
• At 9:00 AM ET: S&P/Case-Shiller House Price Index for July. The consensus is for a 3.8% year-over-year increase in the Comp 20 index for July.
September 28 COVID-19 Test Results
by Calculated Risk on 9/28/2020 07:11:00 PM
The US is now mostly reporting over 700,000 tests per day. Based on the experience of other countries, the percent positive needs to be well under 5% to really push down new infections, so the US still needs to increase the number of tests per day significantly (or take actions to push down the number of new infections).
There were 960,631 test results reported over the last 24 hours.
There were 36,741 positive tests.
Over 21,000 Americans have died from COVID so far in September. See the graph on US Daily Deaths here.

This data is from the COVID Tracking Project.
The percent positive over the last 24 hours was 3.8% (red line is 7 day average).
For the status of contact tracing by state, check out testandtrace.com.
And check out COVID Exit Strategy to see how each state is doing.

The dashed line is the June low.
Note that there were very few tests available in March and April, and many cases were missed (the percent positive was very high - see first graph). By June, the percent positive had dropped below 5%.
If people stay vigilant, the number of cases might drop to the June low some time in October (that would still be a large number of new cases, but progress).
MBA Survey: "Share of Mortgage Loans in Forbearance Declines to 6.87%"
by Calculated Risk on 9/28/2020 04:05:00 PM
Note: This is as of September 20th.
From the MBA: Share of Mortgage Loans in Forbearance Declines to 6.87%
The Mortgage Bankers Association’s (MBA) latest Forbearance and Call Volume Survey revealed that the total number of loans now in forbearance decreased by 6 basis points from 6.93% of servicers’ portfolio volume in the prior week to 6.87% as of September 20, 2020. According to MBA’s estimate, 3.4 million homeowners are in forbearance plans.
...
“The share of loans in forbearance continues to decline and is now at a level not seen since mid-April. Many homeowners with GSE loans are exiting forbearance into a deferral plan and resuming their original mortgage payment, but waiting to pay the forborne amount until the end of the loan,” said Mike Fratantoni, MBA’s Senior Vice President and Chief Economist. “However, the overall picture is still somewhat of a mixed bag. The recent uptick in forbearance requests, particularly for those with FHA or VA loans, is leaving the Ginnie Mae share elevated, as the pace of new requests meets or exceeds the pace of exits.”
Added Fratantoni, “The continued churn in the job market is likely keeping many homeowners who have been in forbearance reluctant to exit, given the level of economic uncertainty.”
...
By stage, 30.26% of total loans in forbearance are in the initial forbearance plan stage, while 68.37% are in a forbearance extension. The remaining 1.37% are forbearance re-entries.
emphasis added
 Click on graph for larger image.
This graph shows the percent of portfolio in forbearance by investor type over time. Most of the increase was in late March and early April, and has been trending down for the last few months.
The MBA notes: "Total weekly forbearance requests as a percent of servicing portfolio volume (#) increased relative to the prior week: from 0.10% to 0.11%"
There hasn't been a pickup in forbearance activity related to the end of the extra unemployment benefits.
New Home Prices
by Calculated Risk on 9/28/2020 01:57:00 PM
As part of the new home sales report released last week, the Census Bureau reported the number of homes sold by price and the average and median prices.
From the Census Bureau: "The median sales price of new houses sold in August 2020 was $312,800. The average sales price was $369,000."
The following graph shows the median and average new home prices.

During the housing bust, the builders had to build smaller and less expensive homes to compete with all the distressed sales. When housing started to recovery - with limited finished lots in recovering areas - builders moved to higher price points to maximize profits.
The average price in August 2020 was $369,000, down 0.8% from July, and down 8.4% from the peak in 2017. The median price was $312,800, down 4.6% from July, and down 8.9% from the peak in 2017.
The average and median house prices have mostly moved sideways since 2017 due to home builders offering more lower priced homes.
The second graph shows the percent of new homes sold by price.

The $400K+ bracket increased significantly since the housing recovery started, but has been holding steady recently - and declined over the last year. A majority of new homes (about 66%) in the U.S., are in the $200K to $400K range.
Dallas Fed: "Texas Manufacturing Recovery Picks Up Steam" in September
by Calculated Risk on 9/28/2020 10:40:00 AM
From the Dallas Fed: Texas Manufacturing Recovery Picks Up Steam
Texas factory activity expanded in September for the fourth month in a row following a record contraction due to the COVID-19 pandemic, according to business executives responding to the Texas Manufacturing Outlook Survey. The production index, a key measure of state manufacturing conditions, rose nine points to 22.3, its highest reading in two years.This was the last of the regional Fed surveys for September.
Other measures of manufacturing activity point to above-average growth this month. The new orders index advanced five points to 14.7, and the growth rate of orders index held fairly steady at 13.2. The capacity utilization index rose from 10.9 to 17.5, while the shipments index was largely unchanged at 21.5.
Perceptions of broader business conditions continued to improve in September. The general business activity index pushed up six points to 13.6, its highest reading since November 2018. The company outlook index held mostly steady at 14.9, a reading well above average. Uncertainty regarding companies’ outlooks continued to rise, with the index positive but largely unchanged at 6.7.
Labor market measures indicated stronger employment growth and a continued increase in workweek length. The employment index pushed up from 10.6 to 14.5, suggesting more robust hiring.
emphasis added
Here is a graph comparing the regional Fed surveys and the ISM manufacturing index:
 Click on graph for larger image.
The New York and Philly Fed surveys are averaged together (yellow, through September), and five Fed surveys are averaged (blue, through September) including New York, Philly, Richmond, Dallas and Kansas City. The Institute for Supply Management (ISM) PMI (red) is through August (right axis).
The ISM manufacturing index for September will be released on Thursday, October 1st. The consensus is for the ISM to be at 56.2, up from 56.0 in August. Based on these regional surveys, the ISM manufacturing index will likely increase in September from the August level.
Note that these are diffusion indexes, so readings above 0 (or 50 for the ISM) means activity is increasing (it does not mean that activity is back to pre-crisis levels).
Seven High Frequency Indicators for the Economy
by Calculated Risk on 9/28/2020 08:15:00 AM
These indicators are mostly for travel and entertainment - some of the sectors that will recover very slowly.
The TSA is providing daily travel numbers.
 Click on graph for larger image.
This data shows the seven day average of daily total traveler throughput from the TSA for 2019 (Blue) and 2020 (Red).
The dashed line is the percent of last year for the seven day average.
This data is as of September 27th.
The seven day average is down 68% from last year (32% of last year).
There has been a slow increase from the bottom.
The second graph shows the 7 day average of the year-over-year change in diners as tabulated by OpenTable for the US and several selected cities.
 Thanks to OpenTable for providing this restaurant data:
This data is updated through September 26, 2020.
This data is "a sample of restaurants on the OpenTable network across all channels: online reservations, phone reservations, and walk-ins. For year-over-year comparisons by day, we compare to the same day of the week from the same week in the previous year."
Note that this data is for "only the restaurants that have chosen to reopen in a given market". Since some restaurants have not reopened, the actual year-over-year decline is worse than shown.
The 7 day average for New York is still off 63% YoY, and down 33% in Arizona. There was a surge in restaurant dining around Labor Day - hopefully mostly outdoor dining.
 This data shows domestic box office for each week (red) and the maximum and minimum for the previous four years. Data is from BoxOfficeMojo through September 24th.
Note that the data is usually noisy week-to-week and depends on when blockbusters are released.
Movie ticket sales have picked up over the last few weeks, and were at $9 million last week (compared to usually under $200 million per week in the late Summer / early Fall).
Some movie theaters are reopening (probably with limited seating at first).
 This graph shows the seasonal pattern for the hotel occupancy rate using the four week average.
 The red line is for 2020, dash light blue is 2019, blue is the median, and black is for 2009 (the worst year since the Great Depression for hotels - prior to 2020).
This data is through September 19th.
Hotel occupancy is currently down 31.9% year-over-year (and that is boosted by fires and a hurricane).
Notes: Y-axis doesn't start at zero to better show the seasonal change.
The leisure travel season usually peaks at the beginning of August, and then the occupancy rate typically declines sharply in the Fall. With so many schools closed, the leisure travel season might have lasted longer than usual this year, but it is unlikely business travel will pickup significantly in the Fall.
 This graph, based on weekly data from the U.S. Energy Information Administration (EIA), shows gasoline supplied compared to the same week last year of .
At one point, gasoline supplied was off almost 50% YoY.
As of September 19th, gasoline supplied was only off about 8.9% YoY (about 91.1% of normal).
Note: I know several people that have driven to vacation spots - or to visit family - and they usually would have flown. So this might have boosted gasoline consumption and the expense of air travel.
This graph is from Apple mobility. From Apple: "This data is generated by counting the number of requests made to Apple Maps for directions in select countries/regions, sub-regions, and cities." This is just a general guide - people that regularly commute probably don't ask for directions.
There is also some great data on mobility from the Dallas Fed Mobility and Engagement Index. However the index is set "relative to its weekday-specific average over January–February", and is not seasonally adjusted, so we can't tell if an increase in mobility is due to recovery or just the normal increase in the Spring and Summer.
 This data is through September 25th for the United States and several selected cities.
The graph is the running 7 day average to remove the impact of weekends.
IMPORTANT: All data is relative to January 13, 2020. This data is NOT Seasonally Adjusted. People walk and drive more when the weather is nice, so I'm just using the transit data.
According to the Apple data directions requests, public transit in the 7 day average for the US is still only about 58% of the January level. It is at 51% in Los Angeles, and 58% in Houston.
Here is some interesting data on New York subway usage (HT BR).
 This graph is from Todd W Schneider.
This data is through Friday, September 25th.
Schneider has graphs for each borough, and links to all the data sources.
He notes: "Data updates weekly from the MTA’s public turnstile data, usually on Saturday mornings".
Sunday, September 27, 2020
Sunday Night Futures
by Calculated Risk on 9/27/2020 07:31:00 PM
Weekend:
• Schedule for Week of September 27, 2020
Monday:
• At 10:30 AM ET, Dallas Fed Survey of Manufacturing Activity for September. This is the last of the regional surveys for September.
From CNBC: Pre-Market Data and Bloomberg futures S&P 500 are up 9 and DOW futures are up 89 (fair value).
Oil prices were down over the last week with WTI futures at $40.19 per barrel and Brent at $41.91 barrel. A year ago, WTI was at $58, and Brent was at $65 - so WTI oil prices are down about 30% year-over-year.
Here is a graph from Gasbuddy.com for nationwide gasoline prices. Nationally prices are at $2.18 per gallon. A year ago prices were at $2.65 per gallon, so gasoline prices are down $0.47 per gallon year-over-year.
September 27 COVID-19 Test Results
by Calculated Risk on 9/27/2020 06:53:00 PM
The US is now mostly reporting over 700,000 tests per day. Based on the experience of other countries, the percent positive needs to be well under 5% to really push down new infections, so the US still needs to increase the number of tests per day significantly (or take actions to push down the number of new infections).
There were 700,898 test results reported over the last 24 hours.
There were 35,289 positive tests.
Over 21,000 Americans have died from COVID so far in September. See the graph on US Daily Deaths here.

This data is from the COVID Tracking Project.
The percent positive over the last 24 hours was 5.0% (red line is 7 day average).
For the status of contact tracing by state, check out testandtrace.com.
And check out COVID Exit Strategy to see how each state is doing.

The dashed line is the June low.
Note that there were very few tests available in March and April, and many cases were missed (the percent positive was very high - see first graph). By June, the percent positive had dropped below 5%.
If people stay vigilant, the number of cases might drop to the June low some time in October (that would still be a large number of new cases, but progress).
Commercial Real Estate Scarring
by Calculated Risk on 9/27/2020 12:33:00 PM
Here is an article related to some of the commercial real estate (CRE) scarring from the pandemic recession.
From the Financial Times: Destruction of value in US real estate revealed by appraisal data. The article suggests some CRE valuations have declined 25% since early this year.
We will also see a decline in new CRE construction next year based on the recent architect billings, from the AIA: "Architectural billings in August still show little sign of improvement"
And hotel occupancy is down 32% year-over-year, and RevPAR (Revenue per available room) is down over 50% year-over-year.
The most significant damage will be to malls, hotels and some office properties, and also some losses for commercial mortgage-backed securities (CMBS) investors. The goods news is the CMBS market is much smaller than the residential MBS market, and loan-to-values (LTV) are typically much lower for commercial properties than residential. So this will not be a repeat of the housing bubble (or the S&L crisis of the 1980s and early '90s).
Saturday, September 26, 2020
September 26 COVID-19 Test Results
by Calculated Risk on 9/26/2020 06:08:00 PM
The US is now mostly reporting over 700,000 tests per day. Based on the experience of other countries, the percent positive needs to be well under 5% to really push down new infections, so the US still needs to increase the number of tests per day significantly (or take actions to push down the number of new infections).
There were 933,873 test results reported over the last 24 hours.
There were 47,733 positive tests.
Almost 21,000 Americans have died from COVID so far in September. See the graph on US Daily Deaths here.

This data is from the COVID Tracking Project.
The percent positive over the last 24 hours was 5.1% (red line is 7 day average).
For the status of contact tracing by state, check out testandtrace.com.
And check out COVID Exit Strategy to see how each state is doing.

The dashed line is the June low.
Note that there were very few tests available in March and April, and many cases were missed (the percent positive was very high - see first graph). By June, the percent positive had dropped below 5%.
If people stay vigilant, the number of cases might drop to the June low some time in October (that would still be a large number of new cases, but progress).
Schedule for Week of September 27, 2020
by Calculated Risk on 9/26/2020 08:07:00 AM
The key report this week is the September employment report on Friday.
Other key indicators include the third estimate of Q2 GDP, the September ISM manufacturing index, September auto sales, Personal Income and Outlays for August and Case-Shiller house prices for July.
10:30 AM: Dallas Fed Survey of Manufacturing Activity for September. This is the last of the regional surveys for September.
 9:00 AM ET: S&P/Case-Shiller House Price Index for July.
This graph shows the nominal seasonally adjusted National Index, Composite 10 and Composite 20 indexes through the most recent report (the Composite 20 was started in January 2000).
The consensus is for a 3.8% year-over-year increase in the Comp 20 index for July.
7:00 AM ET: The Mortgage Bankers Association (MBA) will release the results for the mortgage purchase applications index.
8:15 AM: The ADP Employment Report for September. This report is for private payrolls only (no government). The consensus is for 605,000 jobs added, up from 428,000 in August.
8:30 AM: Gross Domestic Product, 2nd quarter 2020 (Third estimate). The consensus is that real GDP decreased 31.7% annualized in Q2, unchanged from the second estimate of -31.7%.
9:45 AM: Chicago Purchasing Managers Index for September. The consensus is for a reading of 52.0, up from 51.2 in August.
10:00 AM: Pending Home Sales Index for August. The consensus is 3.2% increase in the index.
8:30 AM: The initial weekly unemployment claims report will be released. Initial claims were 870 thousand the previous week.
8:30 AM: Personal Income and Outlays for August. The consensus is for a 2.2% decrease in personal income, and for a 0.7% increase in personal spending. And for the Core PCE price index to increase 0.3%.
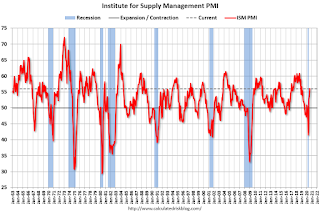 10:00 AM: ISM Manufacturing Index for September. The consensus is for a reading of 56.2, up from 56.0 in August.
Here is a long term graph of the ISM manufacturing index.
The PMI was at 56.0% in August, the employment index was at 46.3%, and the new orders index was at 67.6%.
10:00 AM: Construction Spending for August. The consensus is for a 0.7% increase.
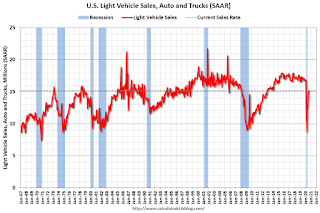 All day: Light vehicle sales for September.
The consensus is for sales of 16.2 million SAAR, up from 15.2 million SAAR in August (Seasonally Adjusted Annual Rate).
This graph shows light vehicle sales since the BEA started keeping data in 1967. The dashed line is the current sales rate.
 8:30 AM: Employment Report for September. The consensus is for 850 thousand jobs added, and for the unemployment rate to decrease to 8.2%.
There were 1.371 million jobs added in August, and the unemployment rate was at 8.4%.
This graph shows the job losses from the start of the employment recession, in percentage terms.
The current employment recession was by far the worst recession since WWII in percentage terms, and the worst in terms of the unemployment rate.
10:00 AM: University of Michigan's Consumer sentiment index (Final for September). The consensus is for a reading of 92.0.
Friday, September 25, 2020
Freddie Mac: Mortgage Serious Delinquency Rate increased in August, Highest Since January 2013
by Calculated Risk on 9/25/2020 08:35:00 PM
Freddie Mac reported that the Single-Family serious delinquency rate in August was 3.17%, up from 3.12% in July. Freddie's rate is up from 0.61% in August 2019.
This is the highest serious delinquency rate since January 2013.
Freddie's serious delinquency rate peaked in February 2010 at 4.20%.
These are mortgage loans that are "three monthly payments or more past due or in foreclosure".
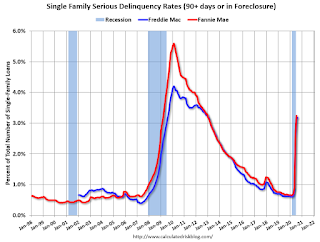
Mortgages in forbearance are being counted as delinquent in this monthly report, but they will not be reported to the credit bureaus.
This is very different from the increase in delinquencies following the housing bubble. Lending standards have been fairly solid over the last decade, and most of these homeowners have equity in their homes - and they will be able to restructure their loans once (if) they are employed.
Note: Fannie Mae will report for August soon.
September 25 COVID-19 Test Results
by Calculated Risk on 9/25/2020 06:48:00 PM
The US is now mostly reporting over 700,000 tests per day. Based on the experience of other countries, the percent positive needs to be well under 5% to really push down new infections, so the US still needs to increase the number of tests per day significantly (or take actions to push down the number of new infections).
There were 907,482 test results reported over the last 24 hours.
There were 50,963 positive tests.
Over 20,000 Americans have died from COVID so far in September. See the graph on US Daily Deaths here.
This data is from the COVID Tracking Project.
The percent positive over the last 24 hours was 5.6% (red line is 7 day average).
For the status of contact tracing by state, check out testandtrace.com.
And check out COVID Exit Strategy to see how each state is doing.

The dashed line is the June low.
Note that there were very few tests available in March and April, and many cases were missed (the percent positive was very high - see first graph). By June, the percent positive had dropped below 5%.
If people stay vigilant, the number of cases might drop to the June low some time in October (that would still be a large number of new cases, but progress).
September Vehicle Sales Forecast: 5% Year-over-year Decline
by Calculated Risk on 9/25/2020 04:43:00 PM
From Wards: U.S. Light Vehicle Sales & Inventory Forecast, September 2020 (pay content)

This graph shows actual sales from the BEA (Blue), and Wards forecast for September (Red).
Sales have bounced back from the April low, but are still down year-over-year.
The Wards forecast of 16.2 million SAAR, would be up 6.6% from August, and down 5.2% from September 2019.
This would put sales in 2020, through September, down about 18% compared to the same period in 2019.
Q3 GDP Forecasts
by Calculated Risk on 9/25/2020 11:38:00 AM
From Merrill Lynch:
We expect 2Q GDP to be unrevised at -31.7% qoq saar in the third and final release. We continue to track 27% qoq saar for 3Q GDP. [Sept 25 estimate]From Goldman Sachs:
emphasis added
The details of the durable goods report were broadly consistent with our expectations. We left our Q3 GDP tracking estimate unchanged at +35% (qoq ar). [Sept 25 estimate]From the NY Fed Nowcasting Report
The New York Fed Staff Nowcast stands at 14.1% for 2020:Q3 and 5.0% for 2020:Q4. [Sept 25 estimate]And from the Altanta Fed: GDPNow
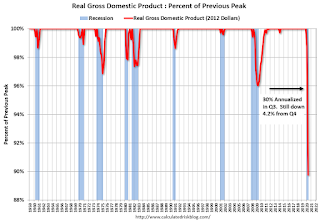
The GDPNow model estimate for real GDP growth (seasonally adjusted annual rate) in the third quarter of 2020 is 32.0 percent on September 25, unchanged from September 17 after rounding. [Sept 25 estimate]It is important to note that GDP is reported at a seasonally adjusted annual rate (SAAR). A 30% annualized increase in Q3 GDP, is about 6.8% QoQ, and would leave real GDP down about 4.2% from Q4 2019.
The following graph illustrates this decline.
 Click on graph for larger image.
This graph shows the percent decline in real GDP from the previous peak (currently the previous peak was in Q4 2019).
This graph is through Q2 2020, and real GDP is currently off 10.2% from the previous peak. For comparison, at the depth of the Great Recession, real GDP was down 4.0% from the previous peak.
The black arrow shows what a 30% annualized increase in real GDP would look like in Q3.
Even with a 30% annualized increase (about 6.8% QoQ), real GDP will be down about 4.2% from Q4 2019; a larger decline in real GDP than at the depth of the Great Recession.
Lawler: Serious Delinquency Rate on FHA-Insured SF Loans Up Again in August
by Calculated Risk on 9/25/2020 09:54:00 AM
From housing economist Tom Lawler: Serious Delinquency Rate on FHA-Insured SF Loans Up Again in August
While the FHA’s “official” monthly loan performance report for August is not yet available on its website, data from the FHA’s Early Warning System indicates that FHA’s Early Warning System indicate that the serious delinquency rate on FHA-insured single-family loans increased to above 11% in August, an all-time monthly high.
Delinquency rates in the EWS do not match those in the official report, but the two delinquency rates tend to move together over time.
| Delinquency Rate, FHA-Insured SF Loans Official Report | ||||
|---|---|---|---|---|
| Total | 30-day | 60-day | SDQ | |
| 2/29/2020 | 10.85% | 5.16% | 1.65% | 4.04% |
| 3/31/2020 | 11.17% | 5.59% | 1.61% | 3.97% |
| 4/30/2020 | 15.52% | 9.20% | 2.28% | 4.04% |
| 5/31/2020 | 17.27% | 6.37% | 5.99% | 4.91% |
| 6/30/2020 | 17.41% | 4.74% | 3.71% | 8.96% |
| 7/31/2020 | 17.24% | 4.15% | 2.51% | 10.58% |
| Early Warning System, Active Servicers | ||||
| 2/29/2020 | 10.63% | 5.16% | 1.66% | 3.81% |
| 3/31/2020 | 10.74% | 5.36% | 1.62% | 3.76% |
| 4/30/2020 | 15.32% | 9.17% | 2.27% | 3.88% |
| 5/31/2020 | 17.15% | 6.37% | 5.99% | 4.80% |
| 6/30/2020 | 17.17% | 4.65% | 3.70% | 8.82% |
| 7/31/2020 | 17.04% | 4.05% | 2.55% | 10.44% |
| 8/31/2020 | 17.43% | 4.07% | 2.20% | 11.17% |
The official Loan Performance Trends Report includes delinquency data for various subcategories, including (Fiscal) Year “Cohorts. Here are some SDQ data by Fiscal Year endorsement.
| FHA SF Serious Delinquency Rate by Fiscal Year1 Cohort | |||
|---|---|---|---|
| 7/31/2020 | 2/29/2020 | 7/31/2019 | |
| All | 10.58% | 4.04% | 3.78% |
| 2015 | 11.65% | 4.54% | 4.07% |
| 2016 | 11.31% | 4.04% | 3.49% |
| 2017 | 11.79% | 4.00% | 3.15% |
| 2018 | 13.14% | 4.32% | 2.49% |
| 2019 | 12.13% | 1.92% | 0.42% |
| 2020 | 5.09% | 0.08% | |
| 1October of the previous to September of the current year | |||
 Click on graph for larger image.
What is striking about these data is that the years with both the largest increases in SDQ’s and the highest SDQ levels were the 2018 and 2019 “cohorts.” These two years were relatively risky books of business, with lower average credit scores compared to the previous 10 years and substantially higher (and never before seen) average debt-to-income ratios than in the previous 10 years.
The surging FHA serious delinquency rate obviously reflects the huge increase in the number of FHA borrowers adversely impacted by the pandemic’s effect on the economy, and most of these seriously delinquent borrowers are in a FHA loan forbearance program. Given this program, combined with the current moratorium on foreclosures, the surging SDQ does not augur any imminent increase in foreclosures.
It does, however, highlight that a sizable number of homeowners (and, presumably, potential homeowners) have been adversely impacted financially by enough to be unable to make their mortgage payments.
This observation, of course, leads one to ask: why have SF family home sales surged by so much this summer?
Obviously, record low mortgage rates have been a catalyst, but it appears as if there has also been a sizeable, pandemic-related shift in the demand for existing householders who have not been materially impacted financially from the pandemic (1) away from urban areas and into suburban (or even more remote) areas, and (2) away from renting in multifamily units and into single-family detached units There has also apparently been a huge increase in demand for second homes, especially but not solely in beach, mountain, and country “resort” areas.
This “discrete” shift in relative demand, combined with limited supply as fewer than normal households already in single-family homes have been moving and listing their property for sale, has already started to put major upward pressure on prices of single-family detached homes, and in some areas of the country have created almost “bubble-like” conditions.
And this discrete shift in demand has played a massively larger role in the surge in SF home sales than “demographics.”
Black Knight: Number of Homeowners in COVID-19-Related Forbearance Plans Decreased
by Calculated Risk on 9/25/2020 08:00:00 AM
Note: Both Black Knight and the MBA (Mortgage Bankers Association) are putting out weekly estimates of mortgages in forbearance.
This data is as of September 22nd.
From Forbearances Down 24% from Peak
The pace of improvement in the number of mortgages in active forbearance increased this week, as the number of plans fell 95K over the past seven days (-2.6%).
This marks five consecutive weeks of improvement and puts us 24% off the peak in late May – a decline of 1.17M plans since that point.
Click on graph for larger image.
As of September 22, 3.6M homeowers remain in COVID-19-related forbearance plans, or 6.8% of all active mortgages, down from 7% last week. Together, they represent $751 billion in unpaid principal.
Servicers continue to proactively assess September-scheduled forbearance expirations for extensions and removals. As of the 22nd, 1.1M forbearance plans are still set to expire this month, down from 1.7M just last week.
...
Over the past month, active forbearance volumes are now down by 9%, with 357k fewer active COVID-19 forbearance plans than at the same time in August. Of the 3.6M loans still in active forbearance, some 78% have had their terms extended at some point since March.
The ongoing COVID-19 pandemic continues to represent significant uncertainty for the weeks ahead. Black Knight will continue to monitor the situation and report our findings on this blog.
emphasis added
Thursday, September 24, 2020
September 24 COVID-19 Test Results
by Calculated Risk on 9/24/2020 06:54:00 PM
The US is now mostly reporting over 700,000 tests per day. Based on the experience of other countries, the percent positive needs to be well under 5% to really push down new infections, so the US still needs to increase the number of tests per day significantly (or take actions to push down the number of new infections).
There were 887,884 test results reported over the last 24 hours.
There were 44,315 positive tests.
Over 19,000 Americans have died from COVID so far in September. See the graph on US Daily Deaths here.

This data is from the COVID Tracking Project.
The percent positive over the last 24 hours was 5.0% (red line is 7 day average).
For the status of contact tracing by state, check out testandtrace.com.
And check out COVID Exit Strategy to see how each state is doing.

The dashed line is the June low.
Note that there were very few tests available in March and April, and many cases were missed (the percent positive was very high - see first graph). By June, the percent positive had dropped below 5%.
If people stay vigilant, the number of cases might drop to the June low some time in October (that would still be a large number of new cases, but progress).
Black Knight: National Mortgage Delinquency Rate Decreased in August, Serious Delinquencies Rise
by Calculated Risk on 9/24/2020 04:33:00 PM
Note: Loans in forbearance are counted as delinquent in this survey, but those loans are not reported as delinquent to the credit bureaus.
From Black Knight: Early-Stage Delinquencies Improve Further, While Seriously Past-Due Loans Rise; Rate of Improvement Slows
• The divergence between early-stage delinquencies and seriously past-due mortgages continues to widen as fewer delinquent loans cured to current status in AugustAccording to Black Knight's First Look report, the percent of loans delinquent decreased 0.5% in August compared to July, and increased 99% year-over-year.
• Overall, the national delinquency rate fell just 0.03 basis points from July after declining a combined 0.85 basis points over the prior two months, a noticeable slowing in the rate of improvement
• The share of borrowers with a single missed payment had already fallen below pre-pandemic levels; in August, the sum of all early-stage delinquencies (those 30 and 60 days past due) fell 9%, dropping below that benchmark as well
• However, the improvement in early-stage delinquencies was offset by a 5% increase in serious delinquencies – those 90 or more days past due – which have now risen in each of the past five months
• August’s rise in serious delinquencies was the mildest of those five months, suggesting that they may be nearing their peak
• While there are nearly 2 million more seriously delinquent homeowners than at pre-pandemic levels, foreclosure activity remains muted due to active forbearance plans and foreclosure moratoriums
emphasis added
The percent of loans in the foreclosure process decreased 1.4% in August and were down 27% over the last year.
Black Knight reported the U.S. mortgage delinquency rate (loans 30 or more days past due, but not in foreclosure) was 6.88% in August, down from 6.81% in July.
The percent of loans in the foreclosure process decreased slightly in August to 0.35% from 0.36% in July.
The number of delinquent properties, but not in foreclosure, is up 1,866,000 properties year-over-year, and the number of properties in the foreclosure process is down 66,000 properties year-over-year.
| Black Knight: Percent Loans Delinquent and in Foreclosure Process | ||||
|---|---|---|---|---|
| August 2020 | July 2020 | August 2019 | August 2018 | |
| Delinquent | 6.88% | 6.91% | 3.45% | 3.52% |
| In Foreclosure | 0.35% | 0.36% | 0.48% | 0.54% |
| Number of properties: | ||||
| Number of properties that are delinquent, but not in foreclosure: | 3,679,000 | 3,692,000 | 1,813,000 | 1,818,000 |
| Number of properties in foreclosure pre-sale inventory: | 187,000 | 190,000 | 253,000 | 280,000 |
| Total Properties | 3,867,000 | 3,881,000 | 2,066,000 | 2,099,000 |
Hotels: Occupancy Rate Declined 32% Year-over-year
by Calculated Risk on 9/24/2020 02:45:00 PM
From HotelNewsNow.com: STR: US hotel results for week ending 19 September
U.S. hotel occupancy was nearly flat from the previous week, according to the latest data from STR.The following graph shows the seasonal pattern for the hotel occupancy rate using the four week average.
13-19 September 2020 (percentage change from comparable week in 2019):
• Occupancy: 48.6% (-31.9%)
• Average daily rate (ADR): US$95.84 (-28.9%)
• Revenue per available room (RevPAR): US$46.54 (-51.6%)
...
Demand rose slightly (+0.3%), and the highest occupancy markets were once again those housing displaced residents from Hurricane Laura and western wildfires, with California South/Central showing the highest level in the metric (74.7%). The Louisiana South (72.8%) and Louisiana North (72.3%) markets were also among the top five highest occupancy levels for the week.
emphasis added
 Click on graph for larger image.
The red line is for 2020, dash light blue is 2019, blue is the median, and black is for 2009 (the worst year since the Great Depression for hotels - before 2020).
There was some boost by Hurricane Laura and the western fires, but it seems unlikely business travel will pickup significantly in the Fall.
Note: Y-axis doesn't start at zero to better show the seasonal change.
Kansas City Fed: "Tenth District Manufacturing Activity Increased at a Slower Pace" in September
by Calculated Risk on 9/24/2020 12:03:00 PM
From the Kansas City Fed: Tenth District Manufacturing Activity Increased at a Slower Pace
The Federal Reserve Bank of Kansas City released the September Manufacturing Survey today. According to Chad Wilkerson, vice president and economist at the Federal Reserve Bank of Kansas City, the survey revealed that Tenth District manufacturing activity increased at a slower pace in September and remained lower than a year ago, while expectations for future activity were positive.This suggests activity has bottomed, but activity is still below a year ago.
“Regional factory activity expanded again in September but was still below year-ago levels for the majority of firms,” said Wilkerson. “Firms’ expectations for future activity continued to be relatively optimistic, although they anticipated slightly lower wage and salary growth in the year ahead.”
The month-over-month composite index was 11 in September, slightly lower than 14 in August but higher than 3 in July ...The composite index is an average of the production, new orders, employment, supplier delivery time, and raw materials inventory indexes. Activity at non-durable and durable goods factories expanded at a similar pace. The increase in activity at food and beverage manufacturers was slower in September than in previous months, when activity bounced back more sharply. Most month-over-month indexes remained positive, indicating continued expansion. Production, shipments, new orders, and employment rose at a slower pace, while order backlog and supplier delivery time increased. The indexes for employee workweek and new orders for exports dipped slightly, and inventory indexes for materials and finished goods were negative.
emphasis added
A few Comments on August New Home Sales
by Calculated Risk on 9/24/2020 10:28:00 AM
New home sales for August were reported at 1,011,000 on a seasonally adjusted annual rate basis (SAAR). Sales for the previous three months were revised up significantly.
This was well above consensus expectations, and this was the highest sales rate since 2006. Clearly low mortgages rates, low existing home supply, and low sales in March and April (due to the pandemic) have led to a strong increase in sales. Favorable demographics (something I wrote about many times over the last decade) and a surging stock market have probably helped new home sales too.
Earlier: New Home Sales increased to 1,011,000 Annual Rate in August.
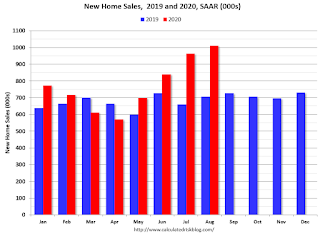
This graph shows new home sales for 2019 and 2020 by month (Seasonally Adjusted Annual Rate).
New home sales were up 43.2% year-over-year (YoY) in August. Year-to-date (YTD) sales are up 14.9%.
And on inventory: since new home sales are reported when the contract is signed - even if the home hasn't been started - new home sales are not limited by inventory. Inventory for new home sales is important in that it means there will be more housing starts if inventory is low (like right now) - and fewer starts if inventory is too high (not now).
Important: No one should get too excited about new home sales as a leading indicator for the economy. Many years ago, I wrote several articles about how new home sales and housing starts (especially single family starts) were some of the best leading indicators, however, I've also noted that there are times when this isn't true. NOW is one of those times.
Currently the course of the economy will be determined by the course of the virus, and New Home Sales tell us nothing about the future of the pandemic. Without the pandemic, I'd obviously be very positive about this report.


