by Calculated Risk on 3/07/2019 09:52:00 AM
Thursday, March 07, 2019
Black Knight Mortgage Monitor for January
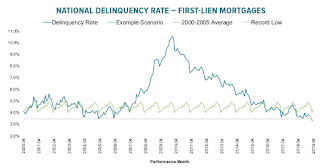
Black Knight released their Mortgage Monitor report for January today. According to Black Knight, 3.75% of mortgages were delinquent in January, down from 4.31% in January 2018. Black Knight also reported that 0.51% of mortgages were in the foreclosure process, down from 0.66% a year ago.
This gives a total of 4.26% delinquent or in foreclosure.
Press Release: Black Knight: Affordability Outlook Improves as Interest Rates Fall; Annual Home Price Growth Continues to Slow, Prices See Fourth Consecutive Monthly Decline
Today, the Data & Analytics division of Black Knight, Inc. released its latest Mortgage Monitor Report, based upon the company’s industry-leading mortgage performance, housing and public records datasets. This month’s report leveraged the latest data from the Black Knight Home Price Index (HPI) to look into the continued slowdown in annual home price appreciation (HPA) and its impact on home affordability. Ben Graboske, president of Black Knight’s Data & Analytics division, explained that while home prices are still up year-over-year in all 50 states and the nation’s 100 largest markets, slowing is noticeable nationwide and – combined with recent interest rate reductions – is helping to improve the overall affordability outlook.
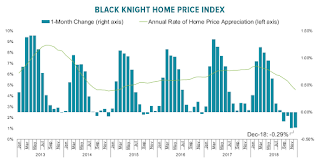
“At the end of December, home prices at the national level had fallen 0.3 percent from November for their fourth consecutive monthly decline,” said Graboske. “As a result, the average home has lost more than $2,400 in value since the summer of 2018. And while home prices are still up on an annual basis, the slowdown continues nationwide and, importantly, is not being driven by seasonal effects. December marked the 10th straight month of slowing annual home price appreciation, falling from a high of 6.8 percent annual growth in February to 4.6 percent at the end of the year. With more than 50 percent of areas reporting, early numbers for January suggest we’re likely to see more of the same. That said, it’s important to keep in mind that annual growth is still outpacing the 25-year average of 3.9 percent – although the gap is closing quickly. Also, it’s yet to be seen what impact the recent pullback in interest rates may have on the national home price growth rate.
“There is good news in these numbers for prospective homebuyers, though. Combined with the average 30-year fixed rate declining by more than half a point over the last three months, housing is now the most affordable it’s been since early in the 2018 home buying season. It currently requires 22.2 percent of median income to purchase the average home with a 20 percent down payment on a 30-year fixed-rate loan. That’s down from a post-recession high of 23.4 percent just a few months ago, and well below the long-term average of 25 percent seen in the late 1990s through the early 2000s, before the housing bubble. The recent decline in rates has translated into a more than 6 percent increase in a homebuyer’s purchase power – while keeping monthly payments the same – or a decrease of $62 a month in principal and interest on the average home bought with 20 percent down. While this is all welcome news for consumers heading into the spring home buying season, it remains to be seen whether recent rate declines and easing affordability will be enough to halt the deceleration in home price growth.”
emphasis added
 Click on graph for larger image.
Here is a graph from the Mortgage Monitor that shows the National delinquency rate over time.
From Black Knight:
• At 3.75%, the national delinquency rate now stands nearly a full percentage point below the pre-recession January average of 4.74%The second graph shows the month-over-month and YoY change in the Black Knight House Price Index:
• February and March tend to be two of the strongest performing months, with delinquencies falling by more than 12% over those two months in an average year
...
• If we saw the average seasonal decline this year, the national delinquency rate would fall to 3.3% in March, nearly 20BPS below the previous record low of 3.48% recorded in March of 2005
• A more pessimistic scenario – which may be wise, as March 2019 ends on a Sunday – has delinquencies closer to 3.5% in March (slightly above the record low), but falling to record lows in April

• The average home declined in value by 0.3% (-$850) in December, marking the fourth consecutive monthly decline in home pricesThere is much more in the mortgage monitor.
• December marked the 10th straight month of slowing annual home price appreciation (HPA), falling from a high of 6.8% annual growth in February to 4.6% at the end of the year
• With more than 50% of areas reporting, early numbers for January suggest we’re likely to see more of the same
…
• Also, it’s yet to be seen what impact the recent pullback in interest rates may have on the national home price growth rate as late December/early January declines haven’t had time to manifest themselves in terms of closed home sales


