by Calculated Risk on 11/08/2018 04:19:00 PM
Thursday, November 08, 2018
AAR: October Rail Carloads Up 1.0% YoY, Intermodal Up 4.2% YoY
From the Association of American Railroads (AAR) Rail Time Indicators. Graphs and excerpts reprinted with permission.
U.S. rail traffic in October 2018 was mixed. Total carloads rose 1.0%, or 12,598. On the positive side, carloads of petroleum and petroleum products surged 28.4% (13,746) in October thanks to higher crude oil shipments; carloads of coal rose 1.6% (6,828 carloads, their first increase in five months); and carloads of steel and other primary metal products rose 9.8% (4,188 carloads, their 21st increase in the past 23 months). … Meanwhile, uncertainties in export markets is hurting grain, carloads of which were down 4.8% (5,620) in October. ... Intermodal did very well in October: volumes were up 4.2%, or 58,546 containers and trailers.
 Click on graph for larger image.
This graph from the Rail Time Indicators report shows U.S. average weekly rail carloads (NSA). Light blue is 2018.
Rail carloads have been weak over the last decade due to the decline in coal shipments.
U.S. railroads originated 1,338,037 carloads in October 2018, up 1.0%, or 12,598 carloads, over October 2017. It’s the eighth straight monthly increase for total carloads, but it’s also the smallest percentage increase in those eight months. In October 2018, 13 of the 20 commodity categories the AAR tracks had carload increases, the fewest since March 2018.
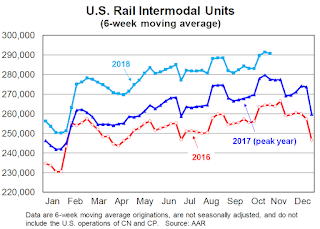
 The second graph is for intermodal traffic (using intermodal or shipping containers):
U.S. railroads originated 1,443,914 containers and trailers in October 2018, up 4.2% (58,546 units) over October 2017. The weekly average in October 2018 was 288,783, the second most (behind June 2018) for any month in history.2018 will be another record year for intermodal traffic.


