 RSS Feed
 by Calculated Risk on 9/27/2016 09:13:00 AM
Tuesday, September 27, 2016
Case-Shiller: National House Price Index increased 5.1% year-over-year in July
S&P/Case-Shiller released the monthly Home Price Indices for July ("July" is a 3 month average of May, June and July prices).
This release includes prices for 20 individual cities, two composite indices (for 10 cities and 20 cities) and the monthly National index.
Note: Case-Shiller reports Not Seasonally Adjusted (NSA), I use the SA data for the graphs.
From S&P: Home Price Gains in July Slow According to the S&P CoreLogic Case-Shiller Indices
The S&P CoreLogic Case-Shiller U.S. National Home Price NSA Index, covering all nine U.S. census divisions, reported a 5.1% annual gain in July, up from 5.0% last month. The 10-City Composite posted a 4.2% annual increase, down from 4.3% the previous month. The 20-City Composite reported a year-over-year gain of 5.0%, down from 5.1% in June.
...
Before seasonal adjustment, the National Index posted a month-over-month gain of 0.7% in July. The 10-City Composite recorded a 0.5% month-over-month increase while the 20-City Composite posted a 0.6% increase in July. After seasonal adjustment, the National Index recorded a 0.4% month-overmonth increase, the 10-City Composite posted a 0.1% decrease, and the 20-City Composite remains unchanged. After seasonal adjustment, 12 cities saw prices rise, two cities were unchanged, and six cities experienced negative monthly prices changes.
emphasis added
 Click on graph for larger image.
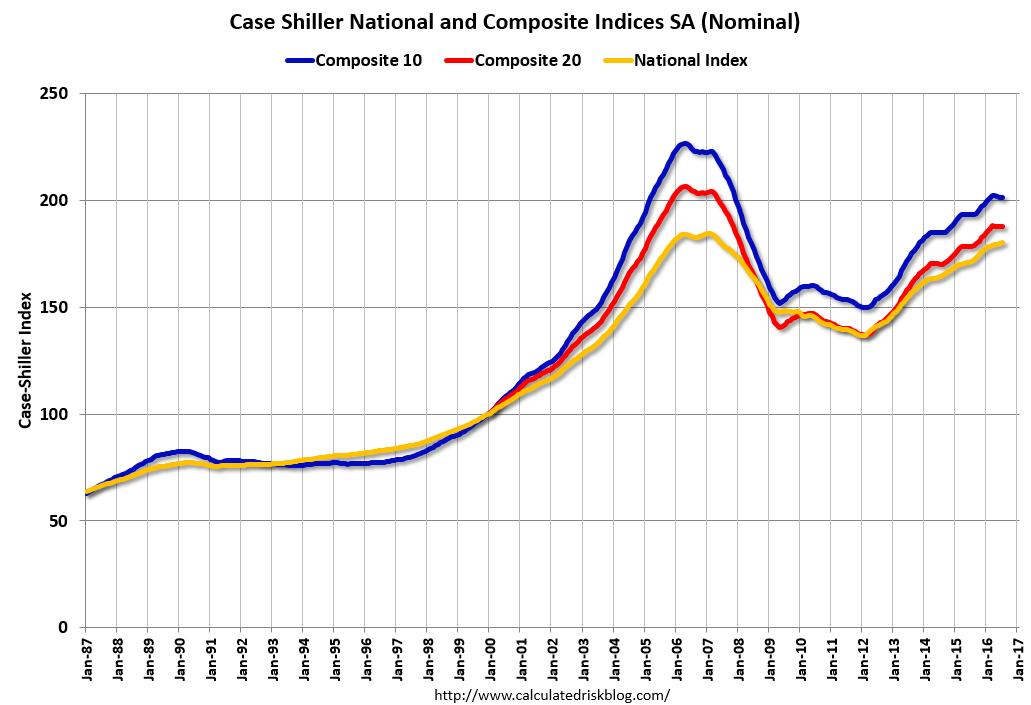
 The first graph shows the nominal seasonally adjusted Composite 10, Composite 20 and National indices (the Composite 20 was started in January 2000).
The Composite 10 index is off 11.1% from the peak, and down slightly in July (SA).
The Composite 20 index is off 9.2% from the peak, and down slightly (SA) in July.
The National index is off 2.2% from the peak (SA), and up 0.4% (SA) in July. The National index is up 32.1% from the post-bubble low set in December 2011 (SA).
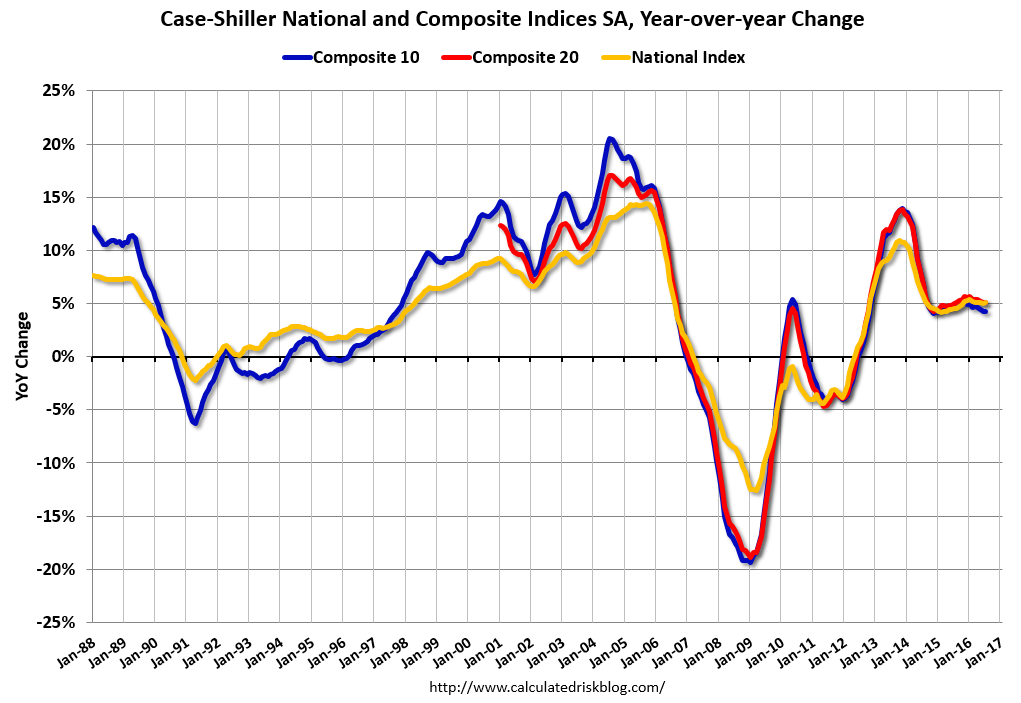 The second graph shows the Year over year change in all three indices.
The Composite 10 SA is up 4.2% compared to July 2015.
The Composite 20 SA is up 5.1% year-over-year.
The National index SA is up 5.1% year-over-year.
Note: According to the data, prices increased in 12 of 20 cities month-over-month seasonally adjusted.
I'll have more later.


