by Calculated Risk on 11/16/2015 02:54:00 PM
Monday, November 16, 2015
Fed Economic Letter: "What’s Different about the Latest Housing Boom?"
From Reuven Glick, Kevin J. Lansing, and Daniel Molitor at the San Francisco Fed: What’s Different about the Latest Housing Boom?
After peaking in March 2006, the median U.S. house price fell about 30%, finally hitting bottom in November 2011. Since then, the median house price has rebounded strongly and is nearly back to its pre-recession peak. In some parts of the country, house prices have reached all-time highs. This Economic Letter assesses recent housing market indicators to gauge whether “this time is different.”
We find that the increase in U.S. house prices since 2011 differs in significant ways from the mid-2000s housing boom. The prior episode can be described as a credit-fueled bubble in which housing valuation—as measured by the house price-to-rent ratio—and household leverage—as measured by the mortgage debt-to-income ratio—rose together in a self-reinforcing feedback loop. In contrast, the more recent episode exhibits a less-pronounced increase in housing valuation together with an outright decline in household leverage—a pattern that is not suggestive of a credit-fueled bubble.
...
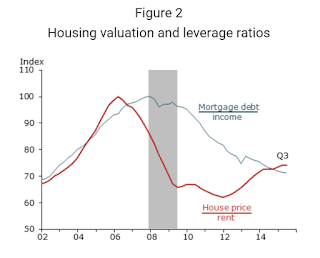
Figure 2 plots the house price-to-rent ratio and the mortgage debt-to-income ratio, each normalized to 100 at its pre-recession peak. The price-to-rent ratio (red line) reached an all-time high in early 2006, marking the apex of the housing bubble. Currently, the price-to-rent ratio is about 25% below the bubble peak. As house prices have recovered since 2011, so too has rent growth, providing some fundamental justification for the upward price movement.
 Click on graph for larger image.
The mortgage debt-to-income ratio (blue line) reached an all-time high in late 2007, coinciding with the peak of the business cycle. An important lesson from history is that bubbles can be extraordinarily costly when accompanied by significant increases in borrowing. On this point, Irving Fisher (1933, p. 341) famously remarked, “over-investment and over-speculation are often important; but they would have far less serious results were they not conducted with borrowed money.”
As house prices rose during the mid-2000s, the lending industry marketed a range of exotic mortgage products to attract borrowers. These included loans requiring no down payment or documentation of income, monthly payments for interest only or less, and adjustable-rate mortgages with low introductory “teaser” rates that reset higher over time. While these were sold as a way to keep monthly payments affordable for new homebuyers, the exotic lending products paradoxically harmed affordability by fueling the price run-up. Empirical studies show that house prices rose faster in places where subprime and exotic mortgages were more prevalent. Furthermore, past house price appreciation in a given area significantly improved loan approval rates in that area (see Gelain, Lansing, and Natvik 2015 for a summary of the evidence).
The official report of the U.S. Financial Crisis Inquiry Commission (2011) states: “Despite the expressed view of many on Wall Street and in Washington that the crisis could not have been foreseen or avoided, there were warning signs. The tragedy was that they were ignored or discounted” (p. xvii). The report lists such red flags as “an explosion in risky subprime lending and securitization, an unsustainable rise in housing prices, widespread reports of egregious and predatory lending practices, [and] dramatic increases in household mortgage debt.”
Figure 2 shows that the house price-to-rent ratio and the mortgage debt-to-income ratio rose together in the mid-2000s, creating a self-reinforcing feedback loop. Since 2011, however, the two ratios have moved in opposite directions; the recent increase in housing valuation has not been associated with an increase in household leverage. Rather, leverage has continued to decline, reflecting a return of prudent lending practices, more vigilant regulatory oversight, and efforts by consumers to repair their balance sheets. The “red flags” are not evident in the current housing recovery. These observations help allay concerns about another credit-fueled bubble.
...
Conclusion
The bursting of an enormous credit-fueled housing bubble during the mid-2000s resulted in a severe recession, the effects of which are still evident more than six years after the episode officially ended. Since bottoming out in 2011, the median U.S. house price has rebounded strongly. However, the latest boom exhibits a less-pronounced increase in the house price-to-rent ratio and an outright decline in the ratio of household mortgage debt to personal disposable income—a pattern that is very different from the prior episode. Nevertheless, given that housing booms and busts can have significant and long-lasting effects on employment and other parts of the economy, policymakers and regulators must remain vigilant to prevent a replay of the mid-2000s experience.


