by Calculated Risk on 5/27/2014 01:40:00 PM
Tuesday, May 27, 2014
Comment on House Prices: Real Prices, Price-to-Rent Ratio
I've been expecting a slowdown in year-over-year prices as "For Sale" inventory slowly increases, and the slowdown might be starting, but this was a still very strong month-to-month increase. The Case-Shiller Composite 20 index was up 1.2% in March 2014 seasonally adjusted (SA). Not much of a slowdown!
In March 2013, the Composite 20 index was up an even stronger 1.7% month-to-month SA, so the year-over-year change was slightly lower in March than in February. This is the fourth consecutive month with lower month-to-month changes than the same month last year. So the year-over-year change has declined from 13.7% in November 2013 to a still very strong 12.4% in March 2014.
It is likely the Case-Shiller Composite 20 index is overstating national price increases due to the inclusion of distressed sales, and the heavy weighting of coastal cities. Other indexes show less price appreciation than Case-Shiller (Black Knight, FNC), and Zillow indicated prices declined slightly in April. So I expect a further decline in the year-over-year change in the Case-Shiller April index (this index is a 3 month average and tends to lag some other indexes).
Also, I've heard talk of a new "bubble" for house prices. And it does appear, by the measures below, that house prices are somewhat above the historical norm. However since there is little evidence of speculative buying, I wouldn't call this a bubble - although these double digit price increases are clearly unsustainable.
Note: My definition of a "bubble", from a post I wrote in April 2005, Housing: Speculation is the Key:
A bubble requires both overvaluation based on fundamentals and speculation. It is natural to focus on an asset’s fundamental value, but the real key for detecting a bubble is speculation ... Speculation tends to chase appreciating assets, and then speculation begets more speculation, until finally, for some reason that will become obvious to all in hindsight, the "bubble" bursts.There was a clear bubble in 2005 with prices much more out of line with fundamentals than now, and rampant speculation with excessive leverage. Currently I'm not concerned.
It is important to look at prices in real terms (inflation adjusted). Case-Shiller, CoreLogic and others report nominal house prices. As an example, if a house price was $200,000 in January 2000, the price would be close to $277,000 today adjusted for inflation (just over 38%). That is why the second graph below is important - this shows "real" prices (adjusted for inflation).
Nominal House Prices
 The first graph shows the quarterly Case-Shiller National Index SA (through Q1 2014), and the monthly Case-Shiller Composite 20 SA and CoreLogic House Price Indexes (through March) in nominal terms as reported.
In nominal terms, the Case-Shiller National index (SA) is back to mid-2004 levels (and also back up to Q2 2008), and the Case-Shiller Composite 20 Index (SA) is back to Nov 2004 levels, and the CoreLogic index (NSA) is back to November 2004.
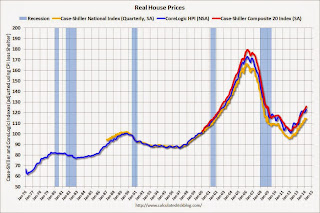
Real House Prices
 The second graph shows the same three indexes in real terms (adjusted for inflation using CPI less Shelter). Note: some people use other inflation measures to adjust for real prices.
In real terms, the National index is back to Q4 2001 levels, the Composite 20 index is back to August 2002, and the CoreLogic index back to June 2002.
In real terms, house prices are back to early '00s levels.
Price-to-Rent
In October 2004, Fed economist John Krainer and researcher Chishen Wei wrote a Fed letter on price to rent ratios: House Prices and Fundamental Value. Kainer and Wei presented a price-to-rent ratio using the OFHEO house price index and the Owners' Equivalent Rent (OER) from the BLS.
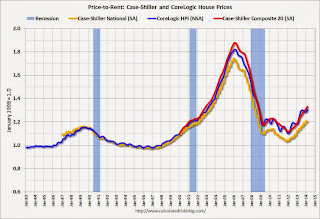
 Here is a similar graph using the Case-Shiller National, Composite 20 and CoreLogic House Price Indexes.
This graph shows the price to rent ratio (January 1998 = 1.0).
On a price-to-rent basis, the Case-Shiller National index is back to Q1 2002 levels, the Composite 20 index is back to December 2002 levels, and the CoreLogic index is back to February 2003.
In real terms, and as a price-to-rent ratio, prices are mostly back to early 2000 levels.


