by Calculated Risk on 11/04/2012 08:32:00 AM
Sunday, November 04, 2012
Retail: Seasonal Hiring vs. Retail Sales
On Friday I noted that retailers hired seasonal workers at slightly above the 2011 pace in October. At the bottom of this post is a graph showing the correlation between seasonal hiring and retail sales.
First, here is the NRF forecast for this year: NRF, Shop.org Expect Solid Growth This Holiday Season
Tempered by political and fiscal uncertainties but supported by signs of improvement in consumer confidence, holiday sales this year will increase 4.1 percent to $586.1 billion. NRF’s 2012 holiday forecast is higher than the 10-year average holiday sales increase of 3.5 percent. Actual holiday sales in 2011 grew 5.6 percent.Note: NRF defines retail sales as including discounters, department stores, grocery stores, and specialty stores, and exclude sales at automotive dealers, gas stations, and restaurants.
“This is the most optimistic forecast NRF has released since the recession. In spite of the uncertainties that exist in our economy and among consumers, we believe we’ll see solid holiday sales growth this year,” said NRF President and CEO Matthew Shay. “Variables including an upcoming presidential election, confusion surrounding the ‘fiscal cliff’ and concern relating to future economic growth could all combine to affect consumers’ spending plans, but overall we are optimistic that retailers promotions will hit the right chord with holiday shoppers.”
Last year the NRF forecast sales to increase 2.8%. At the beginning of November 2011, I posted that that forecast seemed way too low based on seasonal hiring (the NRF related their forecast at the beginning of October). In fact retail sales increased 5.6% last year in November and December.
This is an old idea: Watch what they do, not what they say. And once again the retailers are hiring seasonal workers at a solid pace. Here is a repeat of the graph of retail hiring based on the BLS employment report:
 Click on graph for larger image.
This graph shows the historical net retail jobs added for October, November and December by year.
Retailers hired 130.1 thousand workers (NSA) net in October. This is slightly below the numbers in 2003 through 2006 and about the same as in 2011. Note: this is NSA (Not Seasonally Adjusted).
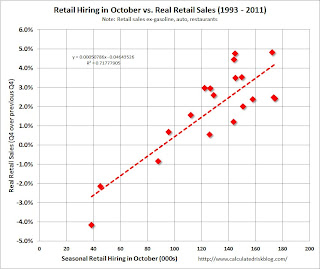
 The scatter graph is for the years 1993 through 2011 and compares October retail hiring with the real increase (inflation adjusted) for retail sales (Q4 over previous Q4).
In general October hiring is a pretty good indicator of seasonal sales. R-square is 0.72 for this small sample. Note: This uses retail sales in Q4, and excludes autos, gasoline and restaurants.
With 130 thousand seasonal hires, this suggests a real gain of around 2.0% in Q4 (plus inflation), very close to the NRF forecast of 4.1% nominal (that includes inflation).


