by Calculated Risk on 10/27/2012 08:09:00 AM
Saturday, October 27, 2012
Summary for Week Ending Oct 26th
There was some disappointing data last week - mostly from some regional manufacturing surveys, but also mortgage delinquencies increased - but overall this was the fourth week in a row with somewhat better than expected data, and this suggests a little pickup in economic activity.
Once again housing beat expectations. New home sales increased to 389,000, a pace well above the 306,000 sales in 2011, and the highest level since the tax credit related spike in April 2010. Q3 GDP was weak, but slightly above expectations - and residential investment was a fairly strong contributor to growth.
The Architecture Billings Index is now showing expansion (an indicator for commercial real estate including apartments). And the trucking index increased in September (although this index has been moving sideways this year).
On the downside, the Richmond and Kansas City Fed manufacturing surveys were weak and indicated contraction in October. The recent trend is continuing: housing is improving, but manufacturing is struggling.
Here is a summary of last week in graphs:
• New Home Sales at 389,000 SAAR in September
 Click on graph for larger image in graph gallery.
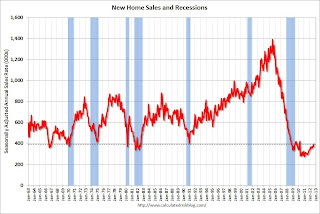
The Census Bureau reported New Home Sales in September were at a seasonally adjusted annual rate (SAAR) of 389 thousand. This was up from a revised 368 thousand SAAR in August (revised down from 373 thousand). This is the highest level since April 2010 (tax credit related bounce).
The first graph shows New Home Sales vs. recessions since 1963. The dashed line is the current sales rate.
Starting in 1973 the Census Bureau broke inventory down into three categories: Not Started, Under Construction, and Completed.
 This graph shows the three categories of inventory starting in 1973.
The inventory of completed homes for sale was at a record low 38,000 units in September. The combined total of completed and under construction is just above the record low since "under construction" is starting to increase.
Even though sales are still very low, new home sales have clearly bottomed. New home sales have averaged 364 thousand SAAR over the first 9 months of 2012, after averaging under 300 thousand for the previous 18 months. Sales are finally above the lows for previous recessions too.
This was slightly above expectations of 385,000, and was another fairly solid report. This indicates an ongoing recovery in residential investment.
• Real GDP increased 2.0% annual rate in Q3
 This graph shows the quarterly real GDP growth (at an annual rate) for the last 30 years.
The Red column (and dashed line) is the advance estimate for Q3 GDP.
The Q3 GDP report was weak, with 2.0% annualized real GDP growth, but slightly better than expected. Final demand increased in Q3 as personal consumption expenditures increased at a 2.0% annual rate (up from 1.5% in Q2), and residential investment increased at a 14.4% annual rate (up from 8.5% in Q2).
Investment in equipment and software was flat in Q3, and investment in non-residential structures was negative. However, it appears the drag from state and local governments will end soon (after declining for 3 years).
The next graph shows the contribution to percent change in GDP for residential investment and state and local governments since 2005.
 The blue bars are for residential investment (RI), and RI was a significant drag on GDP for several years. Now RI has added to GDP growth for the last 6 quarters (through Q3 2012).
However the drag from state and local governments is ongoing, although the drag in Q3 was very small. State and local governments have been a drag on GDP for twelve consecutive quarters. Although not as large a negative as the worst of the housing bust (and much smaller spillover effects), this decline has been relentless and unprecedented. The good news is the drag appears to be ending.
In real terms, state and local government spending is now back to 2001 levels, even with a larger population.
 Residential Investment as a percent of GDP is up from the record lows during the housing bust. Usually RI bounces back quickly following a recession, but this time there is a wide bottom because of the excess supply of existing vacant housing units.
 Last year the increase in RI was mostly from multifamily and home improvement investment. Now the increase is from most categories including single family. I'll break down Residential Investment (RI) into components after the GDP details are released this coming week. Note: Residential investment (RI) includes new single family structures, multifamily structures, home improvement, broker's commissions, and a few minor categories.
The key story is that residential investment is continuing to increase, and I expect this to continue (although the recovery in RI will be sluggish compared to previous recoveries). Since RI is the best leading indicator for the economy, this suggests no recession this year or in 2013 (with the usual caveats about Europe and policy errors in the US).
• AIA: Architecture Billings Index increased in September
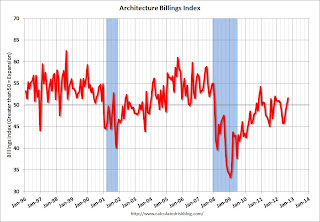
 This graph shows the Architecture Billings Index since 1996. The index was at 51.6 in September, up from 50.2 in August. Anything above 50 indicates expansion in demand for architects' services.
This increase is mostly being driven by demand for design of multi-family residential buildings - and this suggests there are more apartments coming (there are already quite a few apartments under construction). Note: This includes commercial and industrial facilities like hotels and office buildings, multi-family residential, as well as schools, hospitals and other institutions.
According to the AIA, there is an "approximate nine to twelve month lag time between architecture billings and construction spending" on non-residential construction. This suggests increase in CRE investment next year (it will be some time before investment in offices and malls increases).
• ATA Trucking Index increased in September
 From ATA: ATA Truck Tonnage Index Rose 0.4% in September
Note: ATA Chief Economist Bob Costello says, for trucking, the pickup in housing is offsetting the "flattening in manufacturing output".
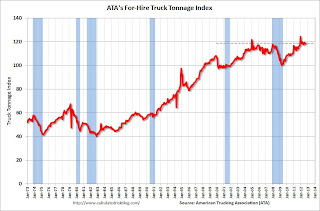
Here is a long term graph that shows ATA's For-Hire Truck Tonnage index.
The dashed line is the current level of the index. The index is above the pre-recession level and up 2.4% year-over-year - but has been mostly moving sideways in 2012.
• Final October Consumer Sentiment at 82.6
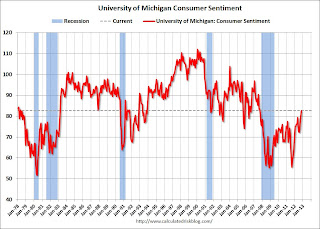
 The final Reuters / University of Michigan consumer sentiment index for October declined to 82.6 from the preliminary reading of 83.1, and was up from the September reading of 78.3.
This was slightly below the consensus forecast of 83.1. Overall sentiment is still weak - probably due to a combination of the high unemployment rate and the sluggish economy - but consumer sentiment has been improving.


