by Calculated Risk on 7/08/2012 11:24:00 AM
Sunday, July 08, 2012
Employment Report Graphs: Participation Rate, Duration of Unemployment and Diffusion Indexes
Below are three more graphs based on the June employment report.
For more employment graphs and analysis, see:
• June Employment Report: 80,000 Jobs, 8.2% Unemployment Rate
• Employment: Another Weak Report (more graphs)
• Percent Job Losses: Great Recession and Great Depression
• All Employment Graphs
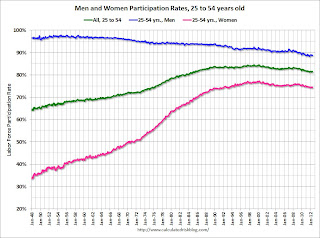
The following graph shows the changes in the participation rates for men and women since 1960 (in the 25 to 54 age group - the prime working years).
 Click on graph for larger image in graph gallery.
The participation rate for women increased significantly from the mid 30s to the mid 70s. This rate was at 75.5% prior to the recession, and declined to a post-recession low of 74.3%. There has been almost no recovery in the participation rate for prime working age women. This rate has mostly flattened out this year, and was still near the low in June at 74.4%.
The participation rate for men has decreased from the high 90s a few decades ago, to a low of 88.3% after the recession. This rate has increased a little and was at 88.8% in June.
There might be some "bounce back" for both men and women (some of the recent decline is probably cyclical), but the long term trend for men is down.
For more on this, see The Declining Participation Rate.
 This graph shows the duration of unemployment as a percent of the civilian labor force. The graph shows the number of unemployed in four categories: less than 5 week, 6 to 14 weeks, 15 to 26 weeks, and 27 weeks or more.
All categories are generally moving down, but there was an increase in the less than 5 week category in June. The other categories remain elevated.
Unfortunately the long term unemployed remains very high at 3.5% of the labor force in June.
 Diffusion indexes are a measure of how widespread job gains are across industries. The further from 50 (above or below), the more widespread the job losses or gains reported by the BLS. If there are employment gains, the more widespread, the better - even if job growth is slow. From the BLS:
 Figures are the percent of industries with employment increasing plus one-half of the industries with unchanged employment, where 50 percent indicates an equal balance between industries with increasing and decreasing employment.The BLS diffusion index for total private employment was at 57.9 in June, down from 59.8 in May. For manufacturing, the diffusion index declined to 51.2 from 53.7 in May.
Even though job growth was weak in June, job growth was still somewhat widespread across industries (a small positive).
Yesterday:
• Summary for Week Ending July 6th
• Schedule for Week of July 8th


