by Calculated Risk on 4/28/2012 08:05:00 AM
Saturday, April 28, 2012
Summary for Week ending April 27th
The GDP report was weaker than expected with 2.2% real GDP growth annualized in Q1 (expectations were for 2.5%). This is disappointing growth, but final demand was a little better than overall GDP. Personal consumption expenditures increased at a 2.9% annual rate in Q1, and residential investment (RI) increased at a 19.1% annual rate. Weather probably boosted PCE and RI - and PCE growth at this rate is not sustainable without more income growth - but this was still decent.
Naturally most of the GDP commentary was pretty negative, but I was a little more sanguine. I expect some of the drag to diminish over the next couple of quarters - as an example, investment in non-residential structures was negative in Q1, however, based on the architecture billing index, I expect the drag from other non-residential categories (offices, malls) to end mid-year. And there was another negative contribution from government spending at all levels. However, it appears the drag from state and local governments will end mid-year (after declining for almost 3 years).
A bright spot - and perhaps the key story - is that residential investment is continuing to increase, and I expect this to continue all year (although the recovery in RI will still be sluggish compared to previous recoveries). Since RI is the best leading indicator for the economy, this suggests no recession this year. Still, overall, this was a weak GDP report.
The new home sales report for March was solid and is further confirmation that the recovery for the housing industry has started. New home sales are up about 17% from the weakest three month period during the housing bust. That is a significant improvement, even if the absolute levels are still very low. The debate is now about the strength of the recovery, not whether there is a recovery. My view is housing will remain sluggish for some time, and I expect 2012 to be another historically weak year, but better than 2011.
Another key report was the Case-Shiller house price index for February. This showed house prices fell to new post-bubble lows (I expect further declines in the March report), but we are starting to see some improvement in the year-over-year change. House prices are important for the economy, and I'm watching closely for signs that prices have stopped falling.
The NMHC Apartment index showed further tightening (suggesting falling vacancy rates and rising rents), and the consumer sentiment index increased. For manufacturing, the Richmond Fed index increased, however the Kansas City Fed manufacturing index showed slower growth.
Here is a summary in graphs:
• Real GDP increased at 2.2% annual rate in Q1

Click on graph for larger image.
The GDP report was weaker than expected, however, on a positive note, final demand was decent. Personal consumption expenditures increased at a 2.9% annual rate in Q1, and residential investment increased at a 19.1% annual rate. Weather probably provided a boost to GDP - and PCE growth at this rate is not sustainable without more income growth - but this was still decent.
 Residential Investment as a percent of GDP is still near record lows, but it is increasing. Usually RI bounces back quickly following a recession, but this time there is a wide bottom because of the excess supply of existing vacant housing units.
Last year the increase in RI was mostly from multifamily and home improvement investment. Now the increase is probably from most categories including single family. I'll break down Residential Investment (RI) into components after the GDP details are released this coming week.
• New Home Sales in March at 328,000 Annual Rate
 The Census Bureau reports New Home Sales in March were at a seasonally adjusted annual rate (SAAR) of 328 thousand. This was down from a revised 353 thousand SAAR in February (revised up sharply from 313 thousand). December and January were revised up too.
This graph shows New Home Sales vs. recessions since 1963. The dashed line is the current sales rate.
Starting in 1973 the Census Bureau broke inventory down into three categories: Not Started, Under Construction, and Completed.
 This graph shows the three categories of inventory starting in 1973.
The inventory of completed homes for sale was at a record low 48,000 units in March. The combined total of completed and under construction is at the lowest level since this series started.
Even though sales are still very low, new home sales have clearly bottomed. New home sales have averaged 335 thousand SAAR over the last 5 months, after averaging under 300 thousand for the previous 18 months. All of the recent revisions have been up too. This was a solid report and above the consensus forecast.
• Case Shiller: House Prices fall to new post-bubble lows in February NSA
 S&P/Case-Shiller released the monthly Home Price Indices for February (a 3 month average of December, January and February).
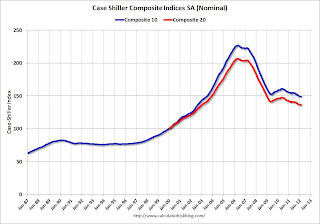
The first graph shows the nominal seasonally adjusted Composite 10 and Composite 20 indices (the Composite 20 was started in January 2000).
The Composite 10 index is off 34.2% from the peak, and up 0.2% in February (SA). The Composite 10 is at a new post bubble low Not Seasonally Adjusted.
The Composite 20 index is off 33.9% from the peak, and up 0.1% (SA) from January. The Composite 20 is also at a new post-bubble low NSA.
The second graph shows the price declines from the peak for each city included in S&P/Case-Shiller indices.
 Prices increased (SA) in 12 of the 20 Case-Shiller cities in February seasonally adjusted (only 3 cities increased NSA). Prices in Las Vegas are off 61.7% from the peak, and prices in Dallas only off 8.2% from the peak.
The NSA indexes are at new post-bubble lows - and the NSA indexes will continue to decline in March (this report was for the three months ending in February).
• Real House Prices and Price-to-Rent Ratio at late '90s Levels
Case-Shiller, CoreLogic and others report nominal house prices. It is also useful to look at house prices in real terms (adjusted for inflation) and as a price-to-rent ratio.
 This graph shows the quarterly Case-Shiller National Index SA (through Q4 2011), and the monthly Case-Shiller Composite 20 SA and CoreLogic House Price Indexes (through February) in real terms (adjusted for inflation using CPI less Shelter). Note: some people use other inflation measures to adjust for real prices.
In real terms, the National index is back to Q4 1998 levels, the Composite 20 index is back to January 2000, and the CoreLogic index back to May 1999.
In real terms, all appreciation in the '00s is gone.
In October 2004, Fed economist John Krainer and researcher Chishen Wei wrote a Fed letter on price to rent ratios: House Prices and Fundamental Value. Kainer and Wei presented a price-to-rent ratio using the OFHEO house price index and the Owners' Equivalent Rent (OER) from the BLS.
 Here is a similar graph using the Case-Shiller National, Composite 20 and CoreLogic House Price Indexes.
This graph shows the price to rent ratio (January 1998 = 1.0).
On a price-to-rent basis, the Case-Shiller National index is back to October 1998 levels, the Composite 20 index is back to February 2000 levels, and the CoreLogic index is back to June 1999.
In real terms - and as a price-to-rent ratio - prices are mostly back to late 1990s or early 2000 levels.
• ATA Trucking index Increased 0.2% in March
 From ATA: ATA Truck Tonnage Index Up 0.2% in March
Here is a long term graph that shows ATA's For-Hire Truck Tonnage index.
The dashed line is the current level of the index. The index is above the pre-recession level and up 2.7% year-over-year. More sluggish growth.
• NMHC Apartment Survey: Market Conditions Tighten in Q1 2012

From the National Multi Housing Council (NMHC): Market Conditions Improve For Apartment Industry
This graph shows the quarterly Apartment Tightness Index. Any reading above 50 indicates tightening from the previous quarter. The index has indicated tighter market conditions for the last nine quarters and suggests falling vacancy rates and or rising rents.
This fits with the recent Reis data showing apartment vacancy rates fell in Q1 2012 to 4.9%, down from 5.2% in Q4 2011, and 9.0% at the end of 2009. This is the lowest vacancy rate in the Reis survey in over 10 years.
This survey indicates demand for apartments is still strong. And even though multifamily starts increased in 2011, completions of apartments were near record lows - so supply was constrained. There will be more completions in 2012, but it looks like another strong year for the apartment industry.
• Consumer Sentiment increases slightly in April to 76.4
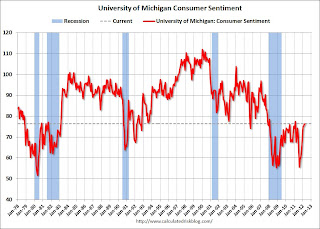
 The final Reuters / University of Michigan consumer sentiment index for April increased slightly to 76.4, up from the preliminary reading of 75.7, and up from the March reading of 76.2.
This was above the consensus forecast of 75.7. Overall sentiment is still fairly weak - probably due to a combination of the high unemployment rate, high gasoline prices and sluggish economy - however sentiment has rebounded from the decline last summer.
• Other Economic Stories ...
• NAR: Pending home sales index increased in March
• FOMC Statement: Economy "expanding moderately"
• FOMC Forecasts and Bernanke Press Conference


