by Calculated Risk on 4/28/2012 01:02:00 PM
Saturday, April 28, 2012
Schedule for Week of April 29th
Earlier:
• Summary for Week Ending April 27th
The key report for this week will be the April employment report to be released on Friday, May 4th. Other key reports include the ISM manufacturing index and vehicle sales on Tuesday, and the ISM non-manufacturing (service) index on Thursday.
In Europe, the ECB meets on Thursday, and France and Greece hold elections next Sunday, May 6th.
8:30 AM ET: Personal Income and Outlays for March. The consensus is for a 0.3% increase in personal income in March, and a 0.4% increase in personal spending, and for the Core PCE price index to increase 0.2%.
9:45 AM: Chicago Purchasing Managers Index for April. The consensus is for a decrease to 60.8, down from 62.2 in March.
10:00 AM: Q1 Housing Vacancies and Homeownership report from the Census Bureau. As a reminder: Be careful with the Housing Vacancies and Homeownership report. This report is frequently mentioned by analysts and the media to track the homeownership rate, and the homeowner and rental vacancy rates. However, based on the initial evaluation, it appears the vacancy rates are too high.
2:00 PM: The April 2012 Senior Loan Officer Opinion Survey on Bank Lending Practices from the Federal Reserve.
All day: Light vehicle sales for April. Light vehicle sales are expected to increase to 14.4 million from 14.3 million in March (Seasonally Adjusted Annual Rate).
 This graph shows light vehicle sales since the BEA started keeping data in 1967. The dashed line is the March sales rate.
 TrueCar is forecasting:
The April 2012 forecast translates into a Seasonally Adjusted Annualized Rate (SAAR) of 14.6 million new car sales, up from 13.2 million in April 2011 and up from 14.4 million in March 2012Edmund.com is forecasting:
April auto sales will continue at the strong pace set in the first quarter for an estimated Seasonally Adjusted Annual Rate (SAAR) this month of 14.4 million light vehicles
 10:00 AM ET: ISM Manufacturing Index for April.
 Here is a long term graph of the ISM manufacturing index. The consensus is for a slight decrease to 53.0 from 53.4 in March.
10:00 AM: Construction Spending for March. The consensus is for a 0.5% increase in construction spending.
7:00 AM: The Mortgage Bankers Association (MBA) will release the mortgage purchase applications index. This index has been weak this year, although this does not include all the cash buyers.
8:15 AM: The ADP Employment Report for April. This report is for private payrolls only (no government). The consensus is for 178,000 payroll jobs added in April, down from the 209,000 reported last month.
10:00 AM: Manufacturers' Shipments, Inventories and Orders (Factory Orders) for March. The consensus is for a 1.6% decrease in orders.
8:30 AM: The initial weekly unemployment claims report will be released. The consensus is for claims to decline to 378,000 from 388,000 last week.
9:00 AM: Ceridian-UCLA Pulse of Commerce Index™ This is the diesel fuel index for April (a measure of transportation).
 10:00 AM: ISM non-Manufacturing Index for April. The consensus is for a decrease to 55.9 from 56.0 in March. Note: Above 50 indicates expansion, below 50 contraction.
This graph shows the ISM non-manufacturing index (started in January 2008) and the ISM non-manufacturing employment diffusion index.
10:00 AM: Trulia Price & Rent Monitors for April. This is the new index from Trulia that uses asking prices adjusted both for the mix of homes listed for sale and for seasonal factors.
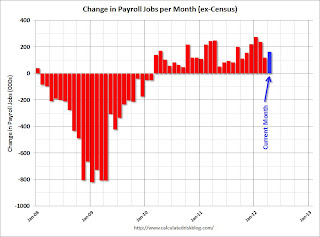
 8:30 AM: Employment Report for April. The consensus is for an increase of 165,000 non-farm payroll jobs in April, up from the 120,000 jobs added in March.
The consensus is for the unemployment rate to remain unchanged at 8.2%.
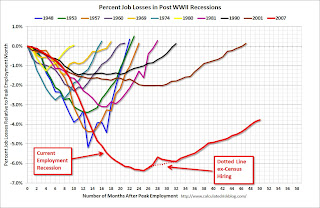
This second employment graph shows the percentage of payroll jobs lost during post WWII recessions through March.
 The economy has added 3.58 million jobs since employment bottomed in February 2010 (4.05 million private sector jobs added, and 474 thousand public sector jobs lost).
There are still 4.8 million fewer private sector jobs now than when the recession started in 2007. (5.2 million fewer total nonfarm jobs).


