by Calculated Risk on 2/18/2012 08:11:00 AM
Saturday, February 18, 2012
Summary for Week ending February 17th
Once again most of the economic data last week was above expectations, and the data suggests some increase in economic activity. We could blame the improvement on better than normal weather – and that was a factor – but with all the bad weather in 2011, it is about time the economy caught a little break.
The strongest data was probably housing starts, especially single family starts. But we have to be careful with the numbers – the weather played a role - and January is seasonally one of the weakest months of the year. The key months for housing starts begin in March. The increase in starts fits with the recent increase in the builder confidence index, but we still haven’t seen a pickup in new home sales (January new home sales will be released next week).
There was some disappointment with the retail sales report for January. Retail sales only increased 0.4%, and that was below expectations for the month. And there was disappointment with inflation as several key measures ticked up a little in January.
Other positive data included another drop in initial weekly unemployment claims, and, for manufacturing, an increase in both the Empire State and Philly Fed manufacturing surveys showing faster expansion in February.
Also the MBA released the results of the Q4 National Delinquency Survey, and mortgage delinquencies declined in Q4 – and according to MBA Chief Economist Jay Brinkmann, delinquencies are about “half way” back to normal. However the number of loans in the foreclosure process is still near record levels.
Overall this was another solid week. Here is a summary in graphs:
• Retail Sales increased 0.4% in January
 Click on graph for larger image.
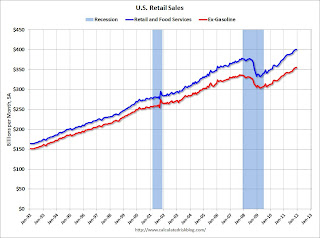
On a monthly basis, retail sales were up 0.4% from December to January (seasonally adjusted, after revisions), and sales were up 5.8% from January 2011. Sales for December were revised down from a 0.1% increase to "virtually unchanged".
This graph shows retail sales since 1992. This is monthly retail sales and food service, seasonally adjusted (total and ex-gasoline).
Retail sales are up 20.7% from the bottom, and now 6.1% above the pre-recession peak (not inflation adjusted).
This was below the consensus forecast for retail sales of a 0.7% increase in January, but above the consensus for a 0.5% increase ex-auto.
• Housing Starts increased in January
 Total housing starts were at 699 thousand (SAAR) in January, up 1.5% from the revised December rate of 689 thousand (SAAR). Note that December was revised up from 657 thousand.
 Single-family starts declined 1.0% to 508 thousand in January, however December was revised up by 43 thousand from 470 thousand. There were the first two months above 500 thousand since the expiration of the tax credit.
This graph shows total and single unit starts since 1968. It now appears both multi-family and single-family starts are moving up, but from very low levels. This was above expectations of 670 thousand starts in January.
• MBA: Mortgage Delinquencies declined in Q4
From the MBA: Delinquencies and Foreclosures Decline in Latest MBA Mortgage Delinquency Survey
 The MBA reported that 11.96 percent of mortgage loans were either one payment delinquent or in the foreclosure process in Q4 2011 (delinquencies seasonally adjusted). This is down from 12.41 percent in Q3 2011 and is the lowest level since 2008.
This graph shows the percent of loans delinquent by days past due.
Loans 30 days delinquent increased to 3.22% from 3.19% in Q3. This is at about 2007 levels.
Delinquent loans in the 60 day bucket decreased to 1.25% from 1.30% in Q4. This is the lowest level since Q4 2007.
There was a decrease in the 90+ day delinquent bucket too. This decreased to 3.11% from 3.50% in Q3 2011. This is the lowest level since 2008, but still way above normal (probably around 1% would be normal).
The percent of loans in the foreclosure process declined slightly to 4.38% from 4.43%. The key problem remains the very high level of seriously delinquent loans and loans in the foreclosure process.
• Industrial Production unchanged in January, Capacity Utilization declines
 This graph shows Capacity Utilization. This series is up 11.3 percentage points from the record low set in June 2009 (the series starts in 1967).
Capacity utilization at 78.5% is still 1.8 percentage points below its average from 1972 to 2010 and below the pre-recession levels of 81.3% in December 2007.
Note: y-axis doesn't start at zero to better show the change.
 This graph shows industrial production since 1967.
Industrial production was unchanged in January at 95.9; December was revised up sharply.
The consensus was for a 0.6% increase in Industrial Production in January, and for an increase to 78.6% for Capacity Utilization. Although below consensus, with the December revisions, this was about at expectations.
• Weekly Initial Unemployment Claims declined to 348,000
 The dashed line on the graph is the current 4-week average. The four-week average of weekly unemployment claims decreased this week to 365,250.
The 4-week moving average is at the lowest level since early 2008.
• Key Measures of Inflation increase in January
 "According to the Federal Reserve Bank of Cleveland, the median Consumer Price Index 0.2% (3.0% annualized rate) in January. The 16% trimmed-mean Consumer Price Index rose 0.2% (2.9% annualized rate) during the month. ... The CPI less food and energy increased 0.2% (2.7% annualized rate) on a seasonally adjusted basis."
This graph shows the year-over-year change for these four key measures of inflation. On a year-over-year basis, the median CPI rose 2.4%, the trimmed-mean CPI rose 2.6%, and core CPI rose 2.3%. Core PCE is for December and increased 1.85% year-over-year. These measures show inflation is still above the Fed's 2% target.
• Empire State and Philly Fed Manufacturing Surveys show stronger expansion
 From the NY Fed: Empire State Manufacturing Survey
The general business conditions index rose six points to 19.5, its highest level in more than a year.This was above the consensus forecast of a reading of 14.1 (above 0 is expansion) and the highest level since June 2010.
From the Philly Fed: February 2012 Business Outlook Survey
The survey’s broadest measure of manufacturing conditions, the diffusion index ofThis indicates expansion in Febraury, at a faster pace than in January, and slightly above the consensus forecast of +8.4.
current activity, edged higher from a reading of 7.3 in January to 10.2, its highest level since October.
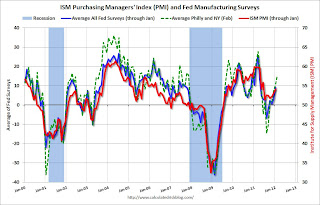
Above is a graph comparing the regional Fed surveys and the ISM manufacturing index. The dashed green line is an average of the NY Fed (Empire State) and Philly Fed surveys through February. The ISM and total Fed surveys are through January.
The average of the Empire State and Philly Fed surveys increased again in February, and is at the highest level since April 2011.
• NFIB: Small Business Optimism Index increased slightly in January
From the National Federation of Independent Business (NFIB): Small Business Confidence in a Lull
 This graph shows the small business optimism index since 1986. The index increased to 93.9 in January from 93.8 in December. This is the fifth increase in a row after declining for six consecutive months.
The optimism index declined sharply in August due to the debt ceiling debate and has now rebounded to about the same level as early in 2011. This index is still low - probably due to a combination of sluggish growth, and the high concentration of real estate related companies in the index.
• Other Economic Stories ...
• NAHB Builder Confidence index increases in February; Highest in over four years
• Residential Remodeling Index increases 22.8% year-over-year in December
• From San Francisco Fed President John Williams: The Federal Reserve’s Mandate and Best Practice Monetary Policy
• Ceridian-UCLA: Diesel Fuel index declined 1.7% in January
• FHA REO Inventory declines to four-year low in December


