by Calculated Risk on 2/16/2012 02:37:00 PM
Thursday, February 16, 2012
Multi-family Starts and Completions, and Quarterly Starts by Intent
With the recent increase in single family housing starts, a key question is: Are the home builders starting too many homes? The answer is no.
Part of the increase for starts in December and January can be explained by the unseasonably warm weather in most of the country. The reported number is seasonally adjusted, and usually January is the weakest month of the year for housing starts - so nice weather can make a difference. Building activity will pick up in March, and that will be a key month for starts.
However the builders are also responding to sales. As I've noted before, we can't directly compare single family housing starts to new home sales. For starts of single family structures, the Census Bureau includes owner built units and units built for rent that are not included in the new home sales report. For an explanation, see from the Census Bureau: Comparing New Home Sales and New Residential Construction
However it is possible to compare "Single Family Starts, Built for Sale" to New Home sales on a quarterly basis. The Q4 2011 quarterly report was released today and showed there were 64,000 single family starts, built for sale, in Q4 2011, and that was slightly below the 68,000 new homes sold for the same quarter. This data is Not Seasonally Adjusted (NSA).
This graph shows the NSA quarterly intent for four start categories since 1975: single family built for sale, owner built (includes contractor built for owner), starts built for rent, and condos built for sale.
 Click on graph for larger image.
Single family starts built for sale were down seasonally in Q4 compared to Q3, but starts were up about 10% compared to Q4 2010. Even with the year-over-year increase, this was still close to the record low. Owner built starts were up slightly year-over-year, and condos built for sale are still very low.
The 'units built for rent' has increased significantly and is up about 67% year-over-year.
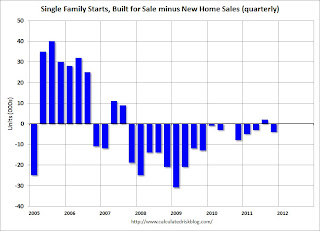
The second graphs shows the difference (quarterly) between single family starts, built for sale and new home sales.
 In 2005, and most of 2006, starts were higher than sales, and inventories of new homes increased. In 2008 and 2009, the home builders started far fewer homes than they sold as they worked off the excess inventory they built up in 2005 and 2006.
For the last two years, the builders have sold a few more homes than they started, and inventory levels are now at record lows. In Q4, builders started 4 thousand fewer homes than they sold.
Note: new home sales are reported when contracts are signed, so it is appropriate to compare sales to starts (as opposed to completions). This is not perfect because of the handling of cancellations.
And here is an update to the graph comparing multi-family starts and completions. Note: it usually takes over a year on average to complete a multi-family project, so there is a lag between multi-family starts and completions. This graph uses a 12 month rolling total.
 The blue line is for multifamily starts and the red line is for multifamily completions.
The rolling 12 month total for starts (blue line) has been increasing since mid-2010. Completions (red line) are now following starts up.
It is important to emphasize that even with a strong increase in multi-family construction, it is 1) from a very low level, and 2) multi-family is a small part of residential investment (RI).
Earlier:
• Weekly Initial Unemployment Claims decline to 348,000
• Housing Starts increase in January
• MBA: Mortgage Delinquencies decline in Q4
• Q4 MBA National Delinquency Survey Comments


