by Calculated Risk on 11/17/2011 08:43:00 PM
Thursday, November 17, 2011
LA Port Traffic in October: Exports increase year-over-year, Imports down
The following graphs are for inbound and outbound traffic at the ports of Los Angeles and Long Beach in TEUs (TEUs: 20-foot equivalent units or 20-foot-long cargo container).
Although containers tell us nothing about value, container traffic does give us an idea of the volume of goods being exported and imported - and possible hints about the trade report for October. LA area ports handle about 40% of the nation's container port traffic.
To remove the strong seasonal component for inbound traffic, the first graph shows the rolling 12 month average.
 Click on graph for larger image.
On a rolling 12 month basis, inbound traffic is down 0.6% from September, and outbound traffic is up 0.3%.
Inbound traffic is "rolling over" and this might suggest that retailers are cautious about the coming holiday season.
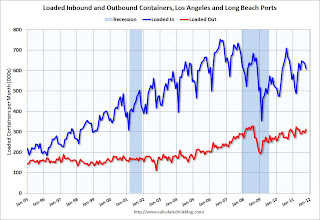
The 2nd graph is the monthly data (with a strong seasonal pattern for imports).
 For the month of October, loaded inbound traffic was down 7% compared to October 2010, and loaded outbound traffic was up 3% compared to October 2010.
Exports have been increasing, although bouncing around month-to-month. Exports are up from last year, but are still below the peak in 2008.
Imports have been soft - this is the 5th month in a row with a year-over-year decline in imports.
Earlier:
• Weekly Initial Unemployment Claims: Four Week average falls under 400,000
• MBA: Mortgage Delinquencies decline slightly in Q3
• Q3 MBA National Delinquency Survey: Comments and State Data
• Philly Fed: "Regional manufacturing is expanding, but at a slow pace"
• Housing Starts decline slightly in October
• Multi-family Starts and Completions, and Quarterly Starts by Intent


