by Calculated Risk on 10/08/2011 08:15:00 AM
Saturday, October 08, 2011
Summary for Week Ending Oct 7th
The U.S. economic data was still fairly weak last week, but the data was mostly better than expected. Of course the European financial crisis dominated the headlines, and the next few weeks will be critical in Europe.
The key U.S. story was the September employment report - and the report indicated sluggish employment growth. There were only 103,000 jobs added in September. This included 137,000 private sector jobs added, and 34,000 government jobs lost.
Employment for July and August were revised up. From the BLS: "The change in total nonfarm payroll employment for July was revised from +85,000 to +127,000, and the change for August was revised from 0 to +57,000." That is an additional 99,000 jobs.
The unemployment rate was unchanged at 9.1%, and the participation rate increased to 64.2% from 64.0%. The employment population ratio also increased to 58.3% from 58.2%. Note: The household survey showed an increase of 398,000 jobs in September. This increase in the household survey kept the unemployment rate from rising, even as more people participated in the workforce (labor force increase by 423,000).
U-6, an alternate measure of labor underutilization that includes part time workers and marginally attached workers, increased to 16.5%; this is at the high for the year.
The average workweek increased slightly to 34.3 hours, and average hourly earnings increase slightly - but that just reversed the decline in August.
Through the first nine months of 2011, the economy has added 1.074 million total non-farm jobs or just 119 thousand per month. This is a better pace of payroll job creation than last year, but the economy still has 6.6 million fewer payroll jobs than at the beginning of the 2007 recession. The economy has added 1.341 million private sector jobs this year, or about 149 thousand per month.
There are a total of 13.992 million Americans unemployed and 6.24 million have been unemployed for more than 6 months. These are very grim numbers.
Overall this was a weak employment report, and the report only looked decent because expectations were so low.
The other economic data was mostly weak, but for the most part also better than expected. The ISM manufacturing index increased in September. Auto sales were up significantly. And construction spending increased in August, and mortgage delinquencies decreased in August.
However the house price index from CoreLogic showed a seasonal decrease in prices in August – and this is probably the beginning of weak house prices through the winter months.
Overall the U.S. data "surprised to the upside" - and suggests sluggish growth. But right now the U.S. data is taking a backseat to the crisis in Europe.
Here is a summary in graphs:
• September Employment Report: 103,000 Jobs, 9.1% Unemployment Rate
 Click on graph for larger image in graph gallery.
This graph shows the job losses from the start of the employment recession, in percentage terms aligned at the start of the recession.
In this post, the graph shows the job losses aligned at maximum job losses.
The red line is moving up slowly - and I'll need to expand the graph soon.
 This graph shows the employment population ratio, the participation rate, and the unemployment rate. The unemployment rate was unchanged at 9.1% (red line).
The Labor Force Participation Rate increased to 64.2% in September (blue line). This is the percentage of the working age population in the labor force.
The Employment-Population ratio increased to 58.3% in September (black line).
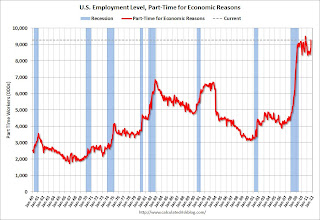
 The number of workers only able to find part time jobs (or have had their hours cut for economic reasons) increased to 9.27 million in September from 8.826 million in August. This is the high for the year.
These workers are included in the alternate measure of labor underutilization (U-6) that increased to 16.5% in September from 16.2% in August.
The next graph shows the duration of unemployment as a percent of the civilian labor force.
 The graph shows the number of unemployed in four categories: less than 5 week, 6 to 14 weeks, 15 to 26 weeks, and 27 weeks or more.
Two categories increased in August: The 27 weeks and more (the long term unemployed) increased to 6.242 million workers, or just over 4.0% of the labor force, and the less than '5 weeks' category increased slightly - this followed the recent increase in initial weekly unemployment claims.
The other two categories decreased. The decrease in the '15 to 26 weeks' group is probably from workers moving into the 27 weeks and more category.
The key point is the that number (and percent) of long term unemployed remains very high.
Here are the employment posts from yesterday:
1) September Employment Report: 103,000 Jobs, 9.1% Unemployment Rate
2) Employment Summary, Part Time Workers, and Unemployed over 26 Weeks
3) Duration of Unemployment, Unemployment by Education and Diffusion Indexes
4) Employment graph gallery
• U.S. Light Vehicle Sales at 13.1 million SAAR in September
 Based on an estimate from Autodata Corp, light vehicle sales were at a 13.1 million SAAR in September. That is up 11.2% from September 2010, and up 8.3% from the sales rate last month (12.1 million SAAR in Aug 2011).
This was well above the consensus forecast of 12.6 million SAAR.
Note: dashed line is current estimated sales rate.
Growth in auto sales should make a positive contribution to Q3 GDP as sales bounced back from the May and June lows. Sales in Q3 have averaged 12.5 million SAAR, above the 12.1 million SAAR average in Q2.
• ISM Manufacturing index increases in September
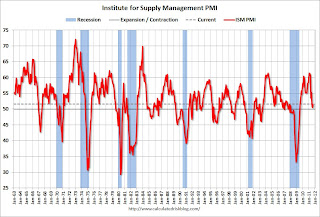
 PMI was at 51.6% in September, up from 50.6% in August. The employment index was at 53.8%, up from 51.8%, and new orders index was unchanged at 49.6%.
Here is a long term graph of the ISM manufacturing index.
This was above expectations of 50.5% and suggests manufacturing expanded at a slightly higher rate in September than in August. It appears manufacturing employment expanded in September with the employment index increasing to 53.8%, up from 51.8% in August.
• Reis: Vacancy Rates for Offices, Apartments and Malls
The vacancy rates is falling quickly for apartments, is declining slightly for offices and still increasing for malls.
 Reis reported the Q3 vacancy rates for offices, apartments and malls.
This graph shows the office vacancy rate starting in 1991.
Reis is reporting the vacancy rate declined to 17.4% in Q3, down from 17.5% in Q2. The vacancy rate was at a cycle high of 17.6% in Q3 2010. It appears the office vacancy rate might have peaked in 2010 - and has only declined slightly since then.

This graph shows the apartment vacancy rate starting in 2005.
Reis is just for large cities, but this decline in vacancy rates is happening just about everywhere.
 From Reuters: U.S. mall Q3 vacancy rate at 11-year high -report
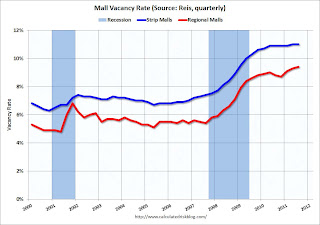
Preliminary figures by real estate research firm Reis Inc show the average vacancy rate at regional malls rose to 9.4 percent in the third quarter, the highest level since Reis began tracking regional mall vacancy rates in 2000 and up from 9.3 percent in the second quarter.• Construction Spending increased in August
...
The vacancy rate at ... local retail strips was 11 percent, flat with the second quarter, Reis said. ... "With demand remaining so weak and more new completions anticipated to come online in the remainder of 2011, there is still a good chance that the vacancy rate will match the 11.1 percent record high observed in 1990 sometime later this year," Reis senior economist Ryan Severino said.
 This graph shows private residential and nonresidential construction spending, and public spending, since 1993. Note: nominal dollars, not inflation adjusted.
Private residential spending is 64.8% below the peak in early 2006, and non-residential spending is 34% below the peak in January 2008.
Public construction spending is now 11% below the peak in March 2009.
 The second graph shows the year-over-year change in construction spending.
On a year-over-year basis, both private residential and non-residential construction spending have turned positive, but public spending is now falling as the stimulus spending ends. The improvements in private non-residential are mostly due to energy spending (power and electric).
• ISM Non-Manufacturing Index indicates expansion in September
 The September ISM Non-manufacturing index was at 53.0%, down from 53.3% in August. The employment index decreased in September to 48.7%, down from 51.6% in August. Note: Above 50 indicates expansion, below 50 contraction.
 This graph shows the ISM non-manufacturing index (started in January 2008) and the ISM non-manufacturing employment diffusion index.
This was slightly above the consensus forecast of 52.9% and indicates slightly slower expansion in September than in August. However the employment index indicated contraction in September.
• LPS: Foreclosure Starts increased in August, Seriously Delinquent Mortgage Loans fall to 2008 levels
 According to LPS, 8.13% of mortgages were delinquent in August, down from 8.34% in July, and down from 9.22% in August 2010.
 LPS reports that 4.11% of mortgages were in the foreclosure process, unchanged from July, and up from 3.8% in August 2010. This gives a total of 12.24% delinquent or in foreclosure. It breaks down as:
• 2.38 million loans less than 90 days delinquent.
• 1.87 million loans 90+ days delinquent.
• 2.15 million loans in foreclosure process.
For a total of 6.40 million loans delinquent or in foreclosure in August.
This graph shows the total delinquent and in-foreclosure rates since 1995.
The total delinquent rate has fallen to 8.13% from the peak in January 2010 of 10.97%. A normal rate is probably in the 4% to 5% range, so there is a long long ways to go.
However the in-foreclosure rate at 4.11% is barely below the peak rate of 4.21% in March 2011. There are still a large number of loans in this category (about 2.15 million) - and the average loan in foreclosure has been delinquent for a record 611 days!
• CoreLogic: Home Price Index declined 0.4% in August
From CoreLogic: CoreLogic® August Home Price Index Shows Month-Over-Month and Year-Over-Year Decline
CoreLogic ... today released its August Home Price Index (HPI) which shows that home prices in the U.S. decreased 0.4 percent on a month-over-month basis, the first monthly decline in four months.
 This graph shows the national CoreLogic HPI data since 1976. January 2000 = 100.
The index was down 0.4% in August, and is down 4.4% over the last year, and off 30.4% from the peak - and up 4.8% from the March 2011 low.
As Mark Fleming noted, some of this decrease is seasonal (the CoreLogic index is NSA). Month-to-month prices changes will probably remain negative through February or March 2012 - the normal seasonal pattern. It is likely that there will be new post-bubble lows for this index late this year or early in 2012.
• Other Economic Stories ...
• ADP: Private Employment increased 91,000 in September
• Consumer Bankruptcy filings down 10 percent through Q3
• Europe Update: New Stress Tests and Bank Recapitalisation
• AAR: Rail Traffic increases in September


