by Calculated Risk on 9/24/2011 08:12:00 AM
Saturday, September 24, 2011
Summary for Week Ending Sept 23rd
The top story of the week was the Fed’s decision “to extend the average maturity of its holdings of securities”, and “reinvest principal payments from its holdings of agency debt and agency mortgage-backed securities in agency mortgage-backed securities”. These measures are intended to reduce longer term interest rates and probably spur another round of mortgage refinancing. For a discussion of the impact, see Jim Hamilton’s Effects of operation twist
The Fed definitely scared investors by adding the word “significant” to their description of downside risks. The August phrase "downside risks to the economic outlook have increased" was changed to "there are significant downside risks to the economic outlook, including strains in global financial markets." (emphasis added). As Tim Duy noted: “The downside risks are now ‘significant’, and we can thank the Europeans for that.”
And once again the European financial crisis was on the front pages. And once again the story seemed to change day-to-day. Early in the week there were reports of good progress in talks with Greece, and later in the week there were less optimistic reports.
In the U.S., talk of a possible double-dip recession continue to grow, however the data released last week still indicated sluggish growth. Housing starts were off a little in August, but are mostly moving sideways. The Architecture Billings Index was positive for the first time in five months. Existing home sales were up in August, although sales will probably decline in September. And weekly initial unemployment claims are still elevated, but declined slightly.
Here is a summary in graphs:
• Existing Home Sales in August: 5.0 million SAAR, 8.5 months of supply
The NAR reported: August Existing-Home Sales Rise Despite Headwinds, Up Strongly from a Year Ago
 Click on graph for larger image in graph gallery.
This graph shows existing home sales, on a Seasonally Adjusted Annual Rate (SAAR) basis since 1993.
Sales in August 2011 (5.03 million SAAR) were 7.7% higher than last month, and were 18.6% above the August 2010 rate (depressed in Aug 2010 following expiration of tax credit).
 The last graph shows the year-over-year (YoY) change in reported existing home inventory and months-of-supply. Since inventory is not seasonally adjusted, so it really helps to look at the YoY change. Note: Months-of-supply is based on the seasonally adjusted sales and not seasonally adjusted inventory.
Inventory decreased 13.1% year-over-year in August from August 2010. This is the seventh consecutive month with a YoY decrease in inventory.
 Months of supply decreased to 8.5 months in August, down from 9.5 months in July. This is much higher than normal.
Here is a graph of existing home sales Not Seasonally Adjusted (NSA).
The red columns are for 2011.
Sales NSA are above last August - of course sales declined sharply last year following the expiration of the tax credit in June 2010 - but sales are also above August 2008 and 2009 (pre-revision).
• Housing Starts declined in August
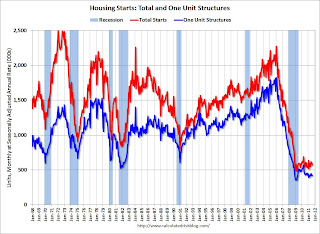
 This graph shows total and single unit starts since 1968.
Total housing starts were at 571 thousand (SAAR) in August, down 5.0% from the revised July rate of 601 thousand (revised from 604).
Single-family starts declined 1.4% to 417 thousand in August.
There was a sharp decline in housing starts following the housing bubble, and housing starts have been mostly moving sideways for about two years and a half years - with slight ups and downs due to the home buyer tax credit.
Multi-family starts are increasing in 2011 - although from a very low level. This was below expectations of 592 thousand starts in August, but permits increased in August suggesting a slight increase for starts in September.
• AIA: Architecture Billings Index Turns Positive
 From AIA: Architecture Billings Index Turns Positive after Four Straight Monthly Declines
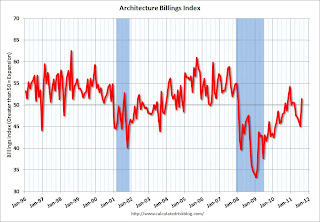
Note: This index is a leading indicator for new Commercial Real Estate (CRE) investment.
This graph shows the Architecture Billings Index since 1996. The index increased to 51.4 in August from 45.1 in July. Anything above 50 indicates expansion in demand for architects' services.
According to the AIA, there is an "approximate nine to twelve month lag time between architecture billings and construction spending" on non-residential construction. So the recent contraction suggests further declines in CRE investment in early 2012, but possibly flattening out in 9 to 12 months (just one month's data).
• Moody's: Commercial Real Estate Prices increased in July
 From Bloomberg: Commercial Real Estate Prices in U.S. Increased 5% in July, Moody’s Says
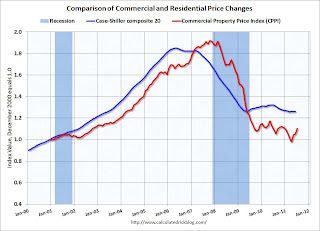
Below is a comparison of the Moodys/REAL Commercial Property Price Index (CPPI) and the Case-Shiller composite 20 index. Beware of the "Real" in the title - this index is not inflation adjusted.
CRE prices only go back to December 2000. The Case-Shiller Composite 20 residential index is in blue (with Dec 2000 set to 1.0 to line up the indexes).
According to Moody's, CRE prices are up 1.2% from a year ago and down about 42% from the peak in 2007. Some of this increase was probably seasonal - also this index is very volatile because there are relatively few transactions. Also, this report was for July, and the index will probably be weaker in August after the debt ceiling debate and the renewed fears about Europe.
• Weekly Initial Unemployment Claims decline slightly to 423,000
The following graph shows the 4-week moving average of weekly claims since January 2000 (there is a longer term graph in graph gallery).
 The DOL reported:
"In the week ending September 17, the advance figure for seasonally adjusted initial claims was 423,000, a decrease of 9,000 from the previous week's revised figure of 432,000. The 4-week moving average was 421,000, an increase of 500 from the previous week's revised average of 420,500."
The dashed line on the graph is the current 4-week average. The four-week average of weekly unemployment claims increased this week to 421,000.
The 4-week average has been increasing recently and this is the highest level since early July.
• Residential Remodeling Index at new high in July
 The BuildFax Residential Remodeling Index was at 130.4 in July, up from 129.5 in June. This is based on the number of properties pulling residential construction permits in a given month.
This is the highest level for the index (started in 2004) - even above the levels from 2004 through 2006 during the home equity ("home ATM") withdrawal boom.
Note: Permits are not adjusted by value, so this doesn't mean there is more money being spent, just more permit activity. Also some smaller remodeling projects are done without permits and the index will miss that activity.
Even though new home construction is still moving sideways, it appears that two other components of residential investment will increase in 2011: multi-family construction and home improvement.
• Other Economic Stories ...
• FOMC Statement: Extend Maturities, Reinvest in agency mortgage-backed securities
• Fed Study: Lack of Home equity and underwriting changes limited Refinancing in 2010
• From Freddie Mac: Fixed-Rate Mortgages Hold Steady, Remain Near Record Lows
• From MarketWatch: August economic indicators signal weak growth
• NAHB Builder Confidence index declines slightly in September
• Philly Fed State Coincident Indexes Decline in August
• DOT: Vehicle Miles Driven decreased 2.5% in July compared to July 2010


