 RSS Feed
 by Calculated Risk on 3/29/2011 02:48:00 PM
Tuesday, March 29, 2011
Philly Fed February State Coincident Indexes
Earlier posts on Case-Shiller house prices:
• Case Shiller: Home Prices Off to a Dismal Start in 2011
• Real House Prices and Price-to-Rent
• House Price Graph Gallery
 Click on map for larger image.
The recovery may be sluggish, but it is fairly widespread geographically.
Here is a map of the three month change in the Philly Fed state coincident indicators. Forty six states are showing increasing three month activity. Four states are showing declining three month activity: Kansas, Delaware, New Jersey, and New Mexico.
Here is the Philadelphia Fed state coincident index release (pdf) for February 2011.
In the past month, the indexes increased in 44 states, decreased in three (Kansas, New Jersey, and Wyoming), and remained unchanged in three (Delaware, New Mexico, and South Dakota) for a one-month diffusion index of 82.
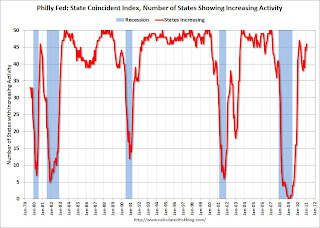 The second graph is of the monthly Philly Fed data for the number of states with one month increasing activity.
 The indexes increased in 44 states, decreased in 3, and remained unchanged in 4. Note: this graph includes states with minor increases (the Philly Fed lists as unchanged).
Several states fell back into declining activity in the 2nd of half of last year, but the situation has improved a little in early 2011.
Note: These are coincident indexes constructed from state employment data. From the Philly Fed:
The coincident indexes combine four state-level indicators to summarize current economic conditions in a single statistic. The four state-level variables in each coincident index are nonfarm payroll employment, average hours worked in manufacturing, the unemployment rate, and wage and salary disbursements deflated by the consumer price index (U.S. city average). The trend for each state’s index is set to the trend of its gross domestic product (GDP), so long-term growth in the state’s index matches long-term growth in its GDP.


