 RSS Feed
 by Calculated Risk on 7/11/2010 08:30:00 AM
Sunday, July 11, 2010
Part 2B: More on Historic Sovereign Default Research
CR Note: This series is from reader "some investor guy". Part 2B is in response to some questions in the comments.
A number of posters mentioned research which was originally part of later sections in the series. I’ve moved some of this research to this ubernerd post.
Some researchers, especially Reinhart and Rogoff, assert that “this time is not different”, and that rather similar things occur before and after defaults throughout the world and over a period of many centuries. Politicians might or might not know the history. However, one wonders to what extent bond traders and CDS market participants agree with the academics.
Within the bond market, CDS market, and the governments themselves, there is also a chance that someone knows important information regarding the chance of default that others do not. For example, an official misstating government revenues, reserves, or borrowing.
There is a very active effort in many countries to convince voters or investors that “everything will be fine” or “all debts will be paid on schedule”. Often, these claims are correct. If interest rates on government bonds and liquidity are set based on perception of risk, the spin might save a sovereign billions of dollars in reduced funding costs. If the spin loses all credibility, a particular government official might be regarded as “The Baghdad Bob of Bonds” (Term derived from the nickname for Saddam Hussseins’s Information Minister, “Baghdad Bob”).
The Research
Paolo Manasse and Nouriel Roubini studied sovereign default risk and concluded that many guidelines used for estimating when default was likely did not perform well when used in isolation, primarily because those guidelines looked at separate risks. For example, total government debt exceeding 200% of GDP is often used to indicate stress. However, some circumstances may make the problems much less severe, others might make it much worse (“Rules of Thumb” for Sovereign Debt Crises, Paolo Manasse and Nouriel Roubini):
“The analysis has one important, albeit simple, implication for sustainability analysis. It shows that unconditional thresholds, for example for debt-output ratios, are of little value per se for assessing the probability of default. One country may be heavily indebted but have a negligible probability of default, while a second may have moderate values of debt ratios while running a considerable default risk. Why? Because the joint effects of short maturity, political uncertainty, and relatively fixed exchange rates make a liquidity crisis in the latter much more likely than a solvency crisis in the former, particularly if the large external debt burden goes together with monetary stability, a large current account surplus, and sound public finances.”
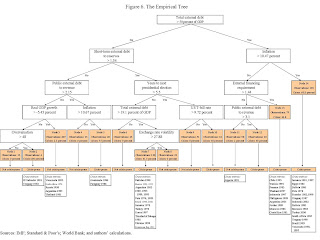 Click on graph for larger image in new window.
Chart source Predicting Sovereign Debt Crises, page 30. For specific countries, default probabilities from this model could be updated as often as the relevant economic data are updated.
In the earlier paper for the IMF, they found (Predicting Sovereign Debt Crises, Paolo Manasse, Nouriel Roubini, and Axel Schimmelpfennig):
“The empirical evidence suggests that a number of macroeconomic factors predict a debt crisis and the entry into a debt crisis. Measures of debt “solvency” matter: high levels of foreign debt (relative to a measure of the ability to pay, such as GDP) increase the probability of a default and entry into default. Measures of illiquidity, particularly short-term debt (relative to foreign reserves), and measures of debt servicing obligations also matter in predicting debt crises, consistent with the view that some recent crises had to do with illiquidity and/or the interaction of illiquidity and insolvency.Another line of research comes from Carmen Reinhart and Kenneth Rogoff. They have several relevant works, including This Time is Different: Eight Centuries of Financial Crises.
Other macroeconomic variables suggested from the analytical literature on debt sustainability also significantly matter for predicting debt crises: low GDP growth; current account imbalances; low trade openness; tight liquidity and monetary conditions in the Group of seven countries; monetary mismanagement (in the form of high inflation); policy uncertainty (in the form of high volatility of inflation); and political uncertainty leading to economic uncertainty (years of presidential elections).”
“We find that serial default is a nearly universal phenomenon as countries struggle to transform themselves from emerging markets to advanced economies. Major default episodes are typically spaced some years (or decades) apart, creating an illusion that “this time is different” among policymakers and investors. A recent example of the “this time is different” syndrome is the false belief that domestic debt is a novel feature of the modern financial landscape. We also confirm that crises frequently emanate from the financial centers with transmission through interest rate shocks and commodity price collapses.”Eight Centuries of Financial Crises also contains quite a bit of data on inflation, which the authors view as a second way to default (if the bonds are denominated in the issuer’s native currency), and exchange rate problems.
 Historically, we will see that the average percent of sovereigns in default or restructuring have sometimes been quite large (source: Eight Centuries of Financial Crises, page 4).
 Rogoff also has analysis of what happens with high debt levels when there is not default. Some readers will enjoy their paper from early 2008, “Is the 2007 U.S. Sub-Prime Financial Crisis So Different?”
We will revisit both sets of authors when looking at the indirect effects of default later in the series. Numerous posters have mentioned Rogoff research showing a possible dropoff in growth above a threshold of 90% debt to GDP (CR Note: this level is disputed).
CR Note: This is from "Some investor guy". Over the next week or so, some investor guy will address several questions: What are market estimates of the probabilities of default? What are total estimated losses on sovereign bonds due to default? What happens if things go really badly and what are the indirect effects of default?
Coming Monday: Part 3. What are the Market Estimates of the Probabilities of Default?
Series:
• Part 1: How Large is the Outstanding Value of Sovereign Bonds?
• Part 2. How Often Have Sovereign Countries Defaulted in the Past?
• Part 2B: More on Historic Sovereign Default Research
• Part 3. What are the Market Estimates of the Probabilities of Default?
• Part 4. What are Total Estimated Losses on Sovereign Bonds Due to Default?
• Part 5A. What Happens If Things Go Really Badly? $15 Trillion of Sovereign Debt in Default
• Part 5B. Part 5B. What Happens If Things Go Really Badly? More Things Can Go Badly: Credit Default Swaps, Interest Swaps and Options, Foreign Exchange
• Part 5C. Some Policy Options, Good and Bad
• Part 5D. European Banks, What if Things Go Really Badly?


