by Calculated Risk on 1/24/2010 12:52:00 PM
Sunday, January 24, 2010
Weekly Summary and a Look Ahead
This will be a busy week for housing data, and the Q4 GDP report will be released on Friday.
On Monday, the National Association of Realtors (NAR) will report existing home sales for December. The consensus is for a significant decline to 5.9 million units (SAAR). From James Hagerty at the WSJ: Why You Can Yawn Over Monday’s Home Sales ‘Shock’
The National Association of Realtors is due to release its monthly report on existing home sales at 10 a.m. Monday, and it’s likely to look lousy. ... Analysts are predicting a sharp drop from November’s level. ...I'd take it one step further and remind everyone that what matters for the economy and jobs is new home sales and housing starts, not existing home sales.
Tom Lawler, a housing economist in rural Virginia ... expects Monday’s report from the Realtors to show that resales in December were down 17% from November to a seasonally adjusted annual rate of 5.42 million. Dan Oppenheim of Credit Suisse expects a 12% drop to 5.76 million. ...
So get over it. In advance.
On Tuesday the Case-Shiller house price index for November will be released. This might show a decline since the LoanPerformance index (see below) has declined for three straight months.
On Wednesday New Home sales for December will be released by the Census Bureau. The consensus is for a slight increase. Also on Wednesday the FOMC meeting announcement will be released (no change to rates or wording is expected).
On Thursday, durable goods will be released and on Friday the Q4 GDP report. The consensus is for 4.5% real GDP growth (annualized), and Goldman Sachs is forecasting 5.8%. Remember, beware the blip and also from Krugman: Blip.
And a summary of last week ...
 Click on graph for larger image in new window.
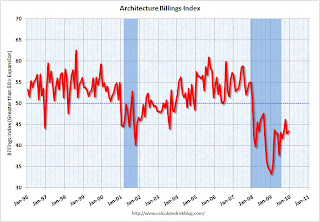
This index is primarily a leading indicator for non-residential construction.
The American Institute of Architects’ Architecture Billings Index increased slightly to 43.4 in December from 42.8 in November. It was at 46.1 in October. Any reading below 50 indicates contraction.
Historically there is an "approximate nine to twelve month lag time between architecture billings and construction spending" on non-residential construction. This suggests further significant declines in CRE investment through 2010, and probably longer.
 Moody's reported: "After 13 consecutive months of declining property values, the Moody’s/REAL Commercial Property Price Index (CPPI) measured a 1.0% increase in prices in November. Prices began falling over two years ago and significant declines were seen throughout 2009, with several months experiencing 5%+ value drops. The 1.0% growth in prices seen in November is a small bright spot for the commercial real estate sector, which has seen values fall over 43% from the peak."
The graph is a comparison of the Moodys/REAL Commercial Property Price Index (CPPI) and the Case-Shiller composite 20 index.
Note that Moody's added: "We expect commercial real estate prices to decline further in the months ahead."
 Total housing starts were at 557 thousand (SAAR) in December, down 4.0% from the revised November rate, and up 16% from the all time record low in April of 479 thousand (the lowest level since the Census Bureau began tracking housing starts in 1959). Starts had rebounded to 590 thousand in June, and have moved mostly sideways for seven months.
Single-family starts were at 456 thousand (SAAR) in December, down 6.9% from the revised November rate, and 28 percent above the record low in January and February (357 thousand). Just like for total starts, single-family starts have been at around this level for seven months.
 This graph shows the builder confidence index from the National Association of Home Builders (NAHB).
The housing market index (HMI) was at 15 in January. This is a decrease from 16 in December and 17 in November
The record low was 8 set in January. This is still very low - and this is what I've expected - a long period of builder depression. The HMI has been in the 15 to 19 range since May.
First American CoreLogic reported: "On a month-over-month basis ... national home prices declined by 0.2 percent in November 2009 compared to October 2009."
 This graph shows the national LoanPerformance data since 1976. January 2000 = 100.
The index is off 5.7% over the last year, and off 30.0% from the peak.
The index has declined for three consecutive months.
Note: this is the house price indicator used by the Fed.
Best wishes to all.


