by Calculated Risk on 1/10/2010 01:59:00 PM
Sunday, January 10, 2010
Weekly Summary and a Look Ahead
Economic news this week includes the trade report for November on Tuesday (consensus is for an increase in the trade deficit from $32.9 billion in October to around $35 billion in November). Retail sales for December will be released on Thursday (consensus is for 0.2% increase ex-auto), and CPI and Industrial Production / Capacity Utilization (for December) on Friday.
I expect the AAR rail traffic report, DOT's vehicle miles, and West coast port traffic data all to be released this week too.
And a summary of last week ...
Here are couple of graphs based on the employment report this week:
 Click on graph for larger image.
This graph shows the job losses from the start of the employment recession, in percentage terms (as opposed to the number of jobs lost). The current employment recession is the worst recession since WWII in percentage terms, and 2nd worst in terms of the unemployment rate (only early '80s recession with a peak of 10.8 percent was worse).
Note: The total jobs lost does not include the annual benchmark payroll revision that will be announced on February 5, 2010. The preliminary estimate is for a downward revision of 824,000 jobs - pushing the total jobs lost over 8 million.
 The second graph (blue line) is the number of workers unemployed for 27 weeks or more. The red line is the same data as a percent of the civilian workforce.
According to the BLS, there are a record 6.13 million workers who have been unemployed for more than 26 weeks (and still want a job). This is a record 4.0% of the civilian workforce. (note: records started in 1948).
For more on the employment report:
-> Employment Report: 85K Jobs Lost, 10% Unemployment Rate
-> Employment-Population Ratio, Part Time Workers, Temporary Workers
-> Unemployed over 26 Weeks, Diffusion Index, Seasonal Retail Hiring
 This graph shows the office vacancy rate starting in 1991.
Reis is reporting the vacancy rate rose to 17.0% in Q4, from 16.6% in Q3 and from 14.5% in Q4 2008. The peak following the previous recession was 16.9%.
-> On offices from Reuters: At 17 pct, US office vacancy rate hits 15-year high
-> On apartments from Reuters: U.S. apartment vacancy rate hits 30-year high
-> On malls from Reuters: US shopping center vacancies hit records - report
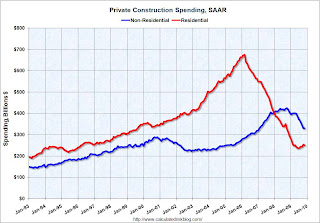
Residential construction spending was off slightly in November, and is now only 5.8% above the bottom earlier in 2009. Non-residential appeared flat in November, but that was only because of a downward revision to October spending. The collapse in non-residential construction spending continues ...
 This graph shows private residential and nonresidential construction spending since 1993. Note: nominal dollars, not inflation adjusted.
Private residential construction spending is now 62.9% below the peak of early 2006.
Private non-residential construction spending is 22.5% below the peak of October 2008.
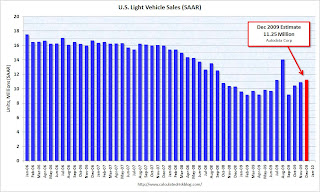
U.S. Light Vehicle Sales 11.25 Million SAAR in December
 This graph shows the historical light vehicle sales (seasonally adjusted annual rate) from the BEA (blue) and an estimate for December (red, light vehicle sales of 11.25 million SAAR from AutoData Corp).
Excluding August (sales driven by "Cash-for-clunkers"), December was the strongest month since September 2008 (12.5 million SAAR) before sales fell off the final cliff.
The current level of sales are still very low, and are still below the lowest point for the '90/'91 recession (even with a larger population). On an annual basis, 2009 sales were probably just above the level of 1982 (10.357 million light vehicles).
Best wishes to all.


