by Calculated Risk on 12/23/2008 12:00:00 PM
Tuesday, December 23, 2008
More on Existing Home Sales
OK, this is a long one on turnover and NSA (not seasonally adjusted) data. The NSA data was much worse than the seasonally adjusted data.
There have been 4.55 million existing home sales in 2008 through November. This puts 2008 on track for about 4.85+ million home sales, the fewest annual sales since 1997 (4.37 million). Click on graph for larger image in new window.
This graph shows annual existing home sales (since 1969) and year end inventory (since 1982). For this graph, sales for 2008 were estimated at 4.85 million and year end inventory at 4.2 million.
This shows sales are the lowest level since 1997, and inventory is at (or will be close) to a record at year end. I expect inventory to decline in December, so 2008 might be below December 2007.
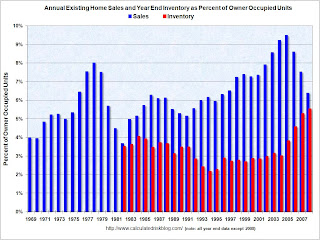
However this has been an above normal year for transactions based on the turnover rate. Long term real estate agents have told me this has been a decent year for volume, although many of the sales are "one and done". Usually real estate sales are like a chain reaction - one family both sells and buys, and the seller then goes out and buys ... and on and on. But with so many REO (Lender "Real Estate Owned") sales by banks, agents have told me they frequently just have the one sale, and there is no move-up buyer - no chain reaction. The second graph shows sales and inventory as a percent of Owner Occupied Units (a measure of turnover).
By this measure sales are still above the normal range of about 6% per year. Inventory is well above the usual range too. I've been expecting turnover to decline to the 5% to 6% per year range, and stay there for an extended period. With 76 million owner occupied households, this suggested that existing home sales would decline to the 3.8 to 4.5 million range. Sales are finally in the predicted range with November sales at a 4.49 million annual rate.
The turnover rate was boosted in recent years by:
Although slowing, the turnover rate is still above the median for the last 40 years and substantially above previous troughs. Both types of speculative buying is now over. And the Baby Boomers have probably bought move up homes, and the next major move will be downsizing in retirement (still a number of years away). And although REO sales will continue to be significant in 2009, they will probably slow some as foreclosures move up the price range.
And finally - and probably a very important point - homeowners with negative equity, who manage to avoid foreclosure, will be stuck in their homes for years. This suggests the turnover rate - and existing home sales - will decline further.
Not Seasonally Adjusted (NSA) data
Here is another way to look at existing homes sales - monthly, Not Seasonally Adjusted (NSA):
 This graph shows NSA monthly existing home sales for 2005 through 2008. Sales (NSA) were about 17% lower in November 2008 than in November 2007 - this is a much larger decline than the reported seasonally adjusted decline.
Note: I've disagreed with the NAR method for seasonal adjustment before. The NAR uses a standard procedure to adjust for weekends and holidays in November. But since the sales were signed in September and October, I think they should adjust for holidays in those months instead. Using a different method, I think sales were closer to 4.2 million SAAR in November than the NAR reported 4.5 million - but it will all come out eventually. (note that NSA sales were 17% below Nov 2007, but SA sales were reported as 10.5% lower).
 The second graph shows inventory by month starting in 2002.
Inventory levels were flat for years (during the bubble), but started increasing at the end of 2005.
Inventory levels increased sharply in 2006 and 2007, but have only increased slightly in 2008. In fact inventory for the last four months was slightly below the levels of last year. This might indicate that inventory levels are close to the peak for this cycle (inventory has peaked for 2008), however there is probably a substantial shadow inventory – homeowners wanting to sell, but waiting for a better market - so existing home inventory levels will probably stay elevated for some time.


