by Calculated Risk on 8/27/2007 11:50:00 AM
Monday, August 27, 2007
More: July Existing Home Sales and Contest
For more existing home sales graphs, please see the previous post: July Existing Home Sales
Contest on Inventory and Months of Supply:
For fun (winner will be announced in a January post), predict:
1) The maximum existing home inventory number for 2007 (NAR report).
2) The maximum "months of supply" for 2007 (NAR report).
The months of supply metric is calculated by dividing the total inventory by the seasonally adjusted annual sales rate, then multiply by 12 months. As an example, the current existing home inventory is 4.592 million units, and the SAAR of sales is 5.750 million units.
The formula is: Months of Supply = (4.592 / 5.750) * 12 = 9.6 months.
Please enter your prediction in the comments to this post. Good luck!
To help with the contest, here are a few more graphs on inventory and months of supply.
 Click on graph for larger image.
The first graph shows the monthly inventory levels for the last four years. There is somewhat of a seasonal pattern, with inventory peaking in the summer months.
This wasn't true in 2005 - as inventory continued to increase throughout the year - and that was one of the indicators that the housing boom had ended.
For 2007, I expect that inventory levels are close to the peak level.

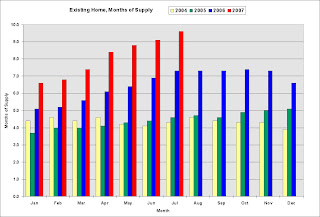
The second graph shows the monthly 'months of supply' metric for the last four years.
Even if inventory levels stabilize, the months of supply could continue to rise - and possibly rise significantly - if sales continue to decline.
To put the NAR numbers into perspective, here are the year-end sales, inventory and months of supply numbers, since 1969.
 This graph shows the actual annual sales, year end inventory and months of supply, since 1982 (sales since 1969). For 2007, the July inventory and Seasonally Adjusted Annual Rate (SAAR) for sales were used.
The current inventory of 4.592 million is the all time record. The "months of supply" metric is 9.6 months. The "months of supply" is now above the level of the previous housing slump in the early '90s, but still below the levels of the housing bust in the early '80s.
Both the numerator and the denominator are moving in the wrong direction. Not only is inventory at record levels, but sales - though falling - are still significantly above the normal range as a percent of owner occupied units.
Forecasts
The following graph shows the actual cumulative existing home sales (through July) vs. three annual forecasts for 2007 made at the beginning of the year (NAR's Lereah, Fannie Mae's Berson, and me).
 My forecast was for sales to be between 5.6 and 5.8 million units (shown as 5.7 million).
NSA sales are 3.498 million units through July. In a typical year, sales through July are about 59% of the sales for the year. So at the current pace, sales will be around 5.9 million. It appears that sales will slow, perhaps significantly, in the second half of 2007, so the risk to my forecast is most likely on the downside.
To reach the NAR forecast, revised downward again on Aug 8th to 6.04 million units, sales would have to be significantly above the 2006 levels for the remainder of the year. Given tighter lending standards, we can probably already say that even the August NAR forecast was too optimistic.


