by Calculated Risk on 10/14/2006 01:20:00 PM
Saturday, October 14, 2006
Tanta's Linkfest on Sub-Prime Mortgages
From Tanta in the comments:
New Century Powerpoint Presentation: extra credit for CR readers who can find the words “repurchase requests,” “early payment delinquencies,” or “fraud” in this document.
 Click on graph for larger image.
Extra-extra credit for anyone who can figure out how loan acquisition cost/productivity and “stronger secondary execution” can be continuing trends in light of New Century’s apparent move to tighten underwriting standards; enhance "its process for confirming the income information on stated income loans"; and improve its disclosures to consumers per Forbes article (hint: these things cost money). “Stronger secondary execution” depends on aggressive bids by whole loan/securities buyers—who are the parties forcing New Century to tighten standards, enhance processes, etc.From the FDIC: Breaking New Ground in U.S. Mortgage Lending
FDIC: Useful for distinguishing between “nonprime” originations, rate of securitization of originations, MBS issue rate, and MBS outstandings (here’s where you get all the differing numbers). Note: FDIC uses “nonprime” to mean “subprime” (cruddy credit) plus “Alt-A” (prime credit but nonprime features such as stated income, high LTV/DTI, etc. “Private label MBS” means MBS issued by someone other than the GSEs). Tidbits:From FDIC Roundtable, CIBC World Markets View: Scenarios for the Next U.S. Recession NOTE: This document shows numbers through 2004. See chart about for 2005 numbers.
*Nonprime originations were 33% of market in 2005, up from 11% in 2003
*In 2005 68% of all originated mortgages were securitized
*Outstanding private-label MBS represented 29 percent of total outstanding MBS in 2005, more than double the share in 2003
*Of total private-label MBS issuance, two-thirds comprised nonprime loans in 2005, up from 46 percent in 2003
Money quote: “Since 1996, subprime lending has grown five-fold (see Chart 46). And these numbers actually may be understated, as a lot of large banks are reticent to admit that they actually have any type of subprime loans. Instead, it has been called non-prime, or non-traditional.” Tanta’s prediction for 2007: “nonperforming” loans will be reclassified as “differently performing.”From CIBC World Markets: Sub-Prime As Prime Target

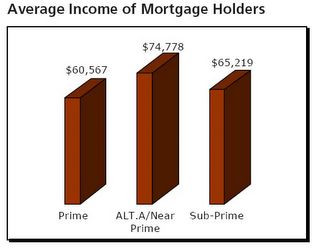
Those crazy Canadians: CIBC World Markets does great analysis on mortgage sector. Here’s a fascinating piece on the rise of subprime lending in the Canadian market (Canada seems to be where US was five years ago). Has some good comparative data for US market, too. Tanta’s favorite part: chart showing average borrower income for prime, Alt-A, and subprime. Extra credit for identifying the category with the highest percentage of stated income loans.And from Nomura Securities: MBS Market – Concepts & Topics
Nomura: More data on breakout of MBS issuance/outstanding by credit type (nice charts). You may find this one helpful (along with the CIBC article) if you are still confused about basic bond terminology/mortgage credit class distinctions. Cool charts on issuance volume by mortgage type.Tanta rocks!


