 RSS Feed
 by Calculated Risk on 8/24/2006 02:25:00 PM
Thursday, August 24, 2006
Update: New Home Sales and Recessions
 Click on graph for larger image.
Here are the updated graphs for New Home Sales vs. recessions, including the July data and revisions.
For an explanation of the 2nd graph, please see this discussion (figure 3): Investment and Recessions 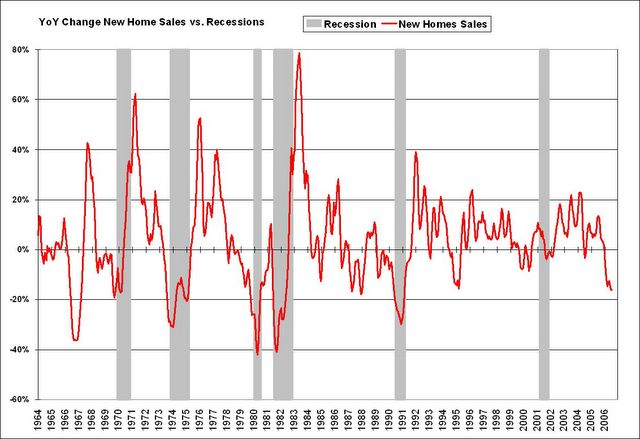
Although sales for July are down over 20% compared to July 2005, the YoY change is down 16% based on the smoothed three month centered average. This indicator is just above the minus 20% threshold.
For another look at New Home Sales data, see: New home sales continue to fall.


