 RSS Feed
 by Calculated Risk on 8/20/2006 11:49:00 PM
Sunday, August 20, 2006
Investment and Recessions
This post will try to explain my focus on residential investment, the usefulness of New Home Sales as a leading indicator, and the current situation.
Note: these graphs may appear cluttered, and for larger versions of each graph, see the links at the end of this post. Click on graph for larger image (see end of post for even larger images)
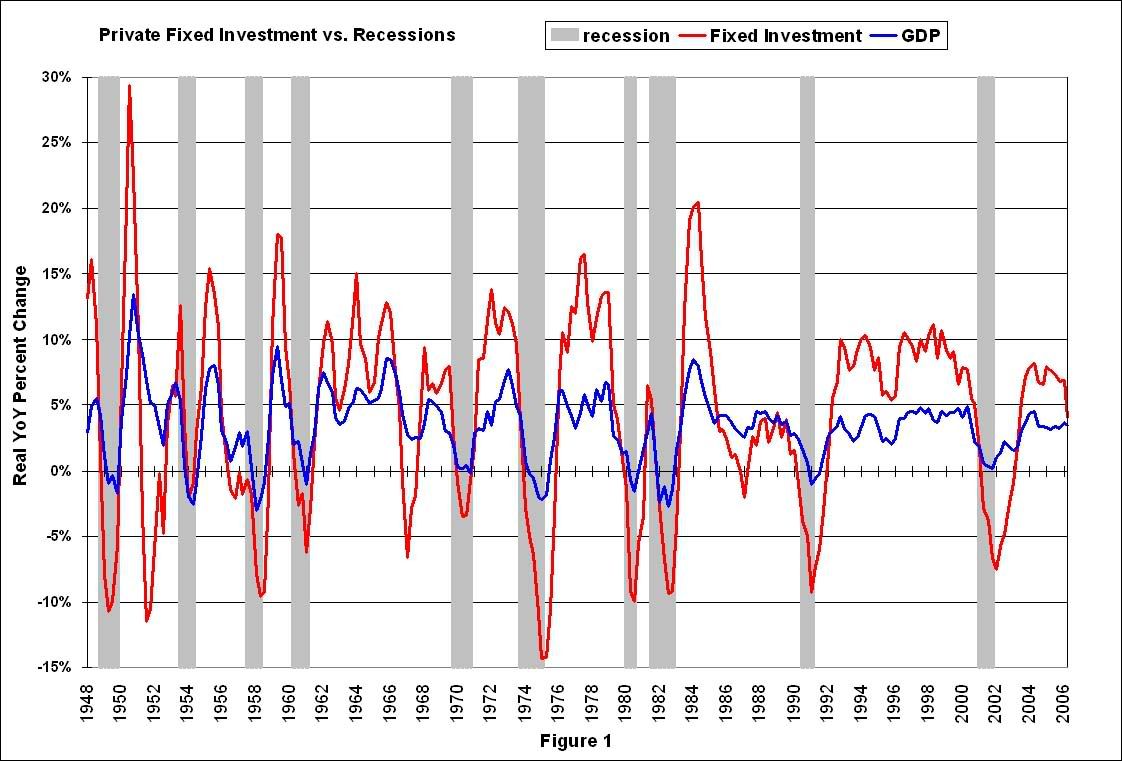
Figure 1 shows the change in real GDP and Private Fixed Investment over the preceding four quarters, shaded areas are recessions. (Source: BEA Table 1.1.1)
A couple of observations:
1) Since 1948, private fixed investment has fallen during every economic recession.
2) Private fixed investment has fallen 13 times since 1948, with only 10 recessions.
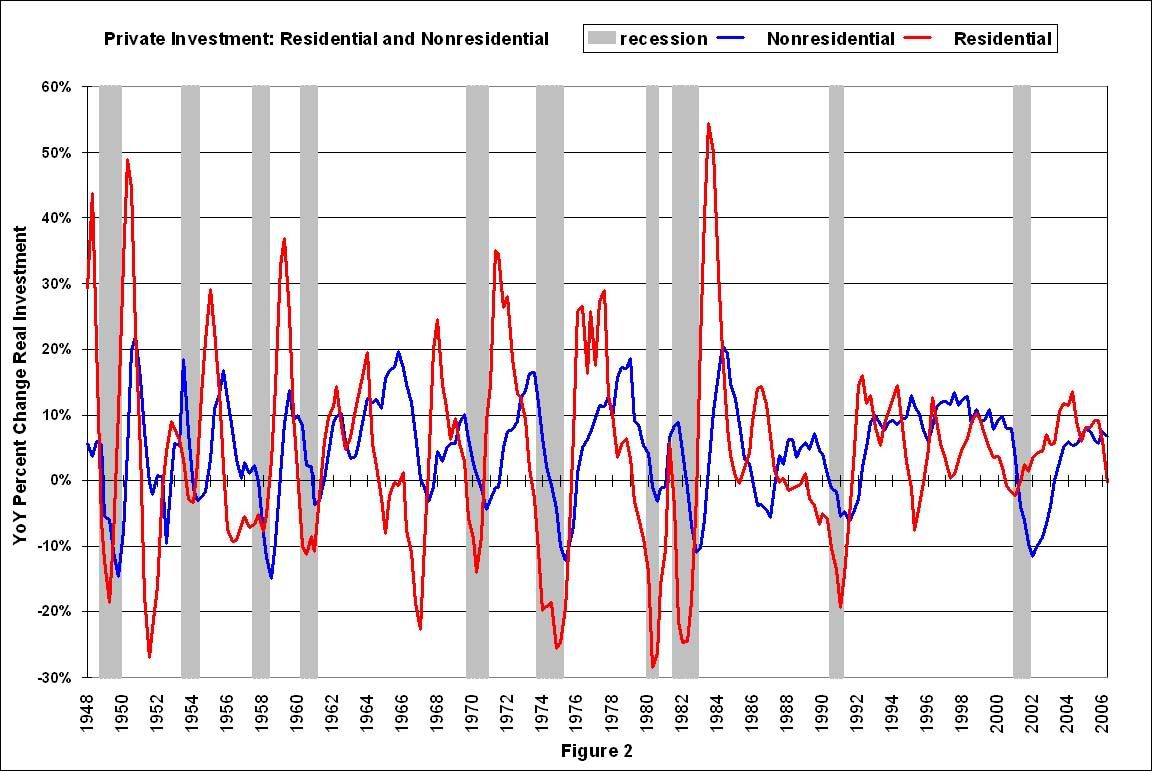
So what happened during the periods around 1951, 1967 and 1986 to keep the economy out of recession? These are the periods when private investment fell, but the economy didn't slide into recession. The answer is generally the same for all three periods: a surge in defense spending. The defense spending in the early '50s was due to the Korean war, in the mid '60s the Vietnam war, and in the mid '80s a general defense build-up helped offset a small decline in private investment. The mid '80s also saw a surge in MEW (mortgage equity withdrawal) that also contributed to GDP growth.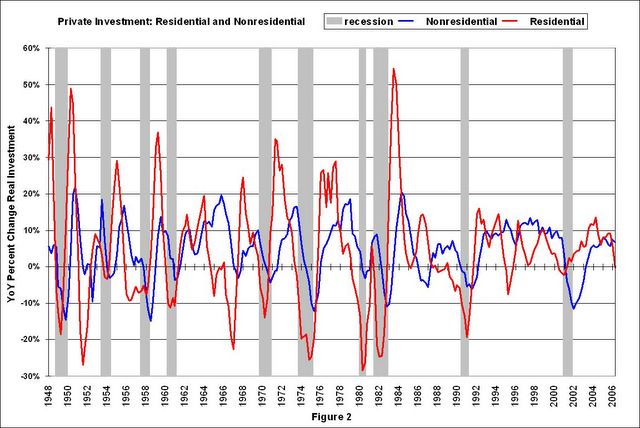 Figure 2 shows the separation of private fixed investment into residential and nonresidential components.
This graphs shows something very interesting: in general, residential investment leads nonresidential investment. There are periods when this observation doesn't hold - like '95 when residential investment fell and the growth of nonresidential investment remained strong.
Another interesting period was 2001 when nonresidential investment fell significantly more than residential investment. Obviously the fall in nonresidential investment was related to the bursting of the stock market bubble.
But the most useful information is that typically recessions are preceded by declines in residential investment. Maybe we can use that information.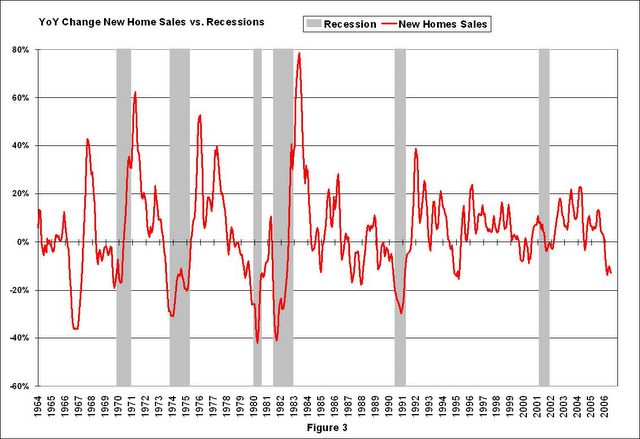
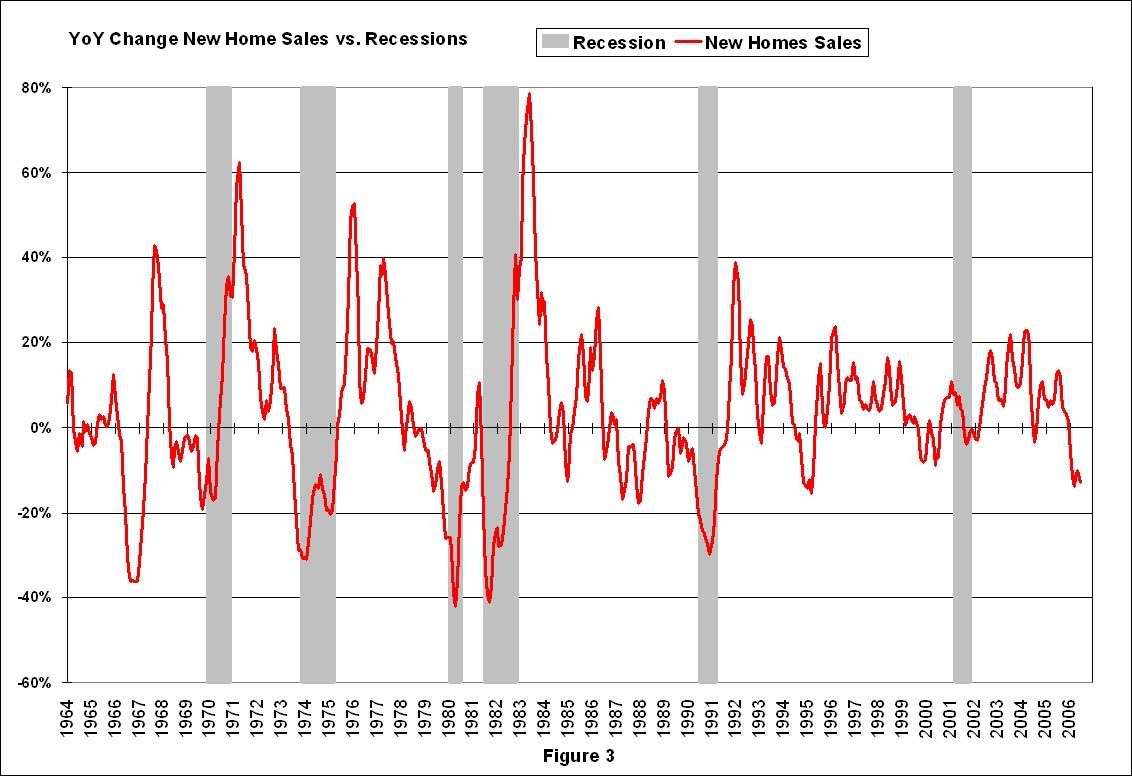
Figure 3 is the YoY change in New Home Sales from the Census Bureau.
Note: the New Home Sales data is smoothed using a three month centered average before calculating the YoY change. The Census Bureau data starts in 1963.
Some observations:
1) When the YoY change in New Home Sales falls about 20%, usually a recession will follow. The one exception for this data series was the mid '60s when the Vietnam buildup kept the economy out of recession.
2) It is also interesting to look at the '86/'87 and the mid '90s periods. New Home sales fell in both of these periods, although not quite 20%. As noted earlier, the mid '80s saw a surge in defense spending and MEW that more than offset the decline in New Home sales. In the mid '90s, nonresidential investment remained strong.
Conclusions:
1) New Home Sales appears to be an excellent leading indicator. However the series is heavily revised and that might limit it's usefulness. I believe the revisions problem can be mitigated using mortgage data from the MBA and builder sentiment from the NAHB to estimate New Home sales (this is for another post).
2) If New Home sales falls to around the 1.05 million level (20% decline), a recession is very likely.
What can offset the decline in New Home sales? Possibilities mentioned earlier are: a surge in defense spending, an increase in consumer borrowing especially MEW, and strong nonresidential investment spending.
An increase in consumer borrowing and MEW seems extremely remote, especially since household debt service is already at record levels. It is far more likely that MEW will fall over the next few years, also acting as a drag on GDP. (A future post will review the contribution from MEW to GDP over the last few years).
Most bullish analysts are forecasting strong nonresidential investment to offset the decrease in residential investment. Maybe. But usually nonresidential investment follows residential investment. Here is a previous post discussing nonresidential investment: Will Business Investment Rescue the Economy?
And defense spending has already increased significantly over the last few years. The implications of a further surge in defense spending, from the current levels, are too scary to contemplate.
NOTE: Click on the links below for 1200x800 graphs in new windows.
Figure 1: Private Fixed Investment vs. Recessions


