 RSS Feed
 by Calculated Risk on 7/31/2006 07:01:00 PM
Monday, July 31, 2006
Roubini: Landing "Hard as it gets"
Nouriel Roubini writes: Dismal GDP Report: U.S. Is on Its Way to a Recession by Year End
... once the signals of this recession build up, the slowing demand, sales, profits, earnings will severely batter the stock market. Expect 10-15% losses on the major equity indexes between now and year end as the bearish reality of a recession sinks in delusional investors still hoping for a soft landing of the economy. There will be no soft landing; it will be as hard a landing as it gets. So, as Bette Davis said in All About Eve: Fasten your seat belts...it's gonna be a bumpy ride! A very bumpy one for the economy and for all risky assets. In 2006 cash is king and all risky assets (equities, EM bonds, currencies and equities, commodities, credit risks and premia) will be battered once the markets finally comes to the realization that a U.S. recession followed by a serious global slowdown is coming.Brad Setser writes: Growth slowing, oil rising ... not good
[T]he global economy [is at risk] as well. Like Dr. Roubini, I am not convinced that Chinese growth is entirely independent of US growth.And more on the US consumer:
Reuters reports: Whole Foods profit up but sales trail estimates
Whole Foods, based in Austin, Texas, has seen explosive growth in recent years as it added stores and profited from a desire among consumers for healthy food and lifestyles. But the latest quarterly report pointed to slower growth as shoppers wrestle with rising energy prices.AP reports: Tyson Foods Shares Drop on 3rd-Qtr. Loss
Shares of Tyson Foods Inc. shed 3 percent on Monday, after the world's largest meat processor reported a fiscal third-quarter loss and predicted only modest improvement in the fourth quarter.It appears consumers are moving away from the higher priced food stuff (natural and organic foods and chicken) to inferior goods. This is similar to the problem with casual dining that I mentioned last week.
Tyson said a persistent glut of chicken, in particular, led to lower sales prices.
...
"The chicken glut continues. The export demand still is not there yet," Warren said. "It's definitely not a Tyson specific problem."
GDP and Mortgage Interest
by Calculated Risk on 7/31/2006 02:59:00 PM
As a supplement to the GDP report, the Bureau of Economic Analysis provides an estimate of aggregate mortgage interest and the effective rate of interest on mortgage debt outstanding. It should come as no surprise that the effective interest rate is increasing.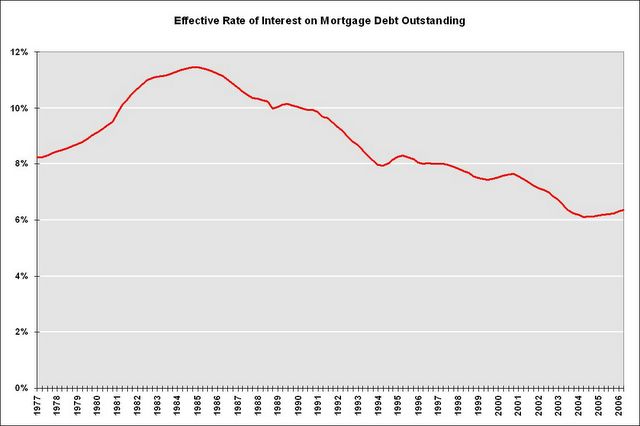
Click on graph for larger image.
After twenty years of declining rates, the effective rate has risen modestly since early 2004. In Q2 2006, the effective rate was 6.373%, up slightly from 6.315% in Q1.
What is surprising is the estimated large increase in mortgage debt in Q2 2006. The actual number will be reported in the FED's Flow of Funds report, due on September 19th, but it appears total mortgage debt increased about $250 to $300 Billion in Q2, or at about the same rate as in 2005.
NOTE: I use the FED's Flow of Funds report to calculate MEW. I'll post an estimated MEW for Q2 in September.
With the slow down in Personal Consumption Expenditures in Q2, it was probably reasonable to expect MEW to fall in Q2 too. This report suggests that MEW was still strong in the second quarter.
It is also no surprise that mortgage interest, as a percent of Disposable Personal Income (DPI), has risen sharply in recent years.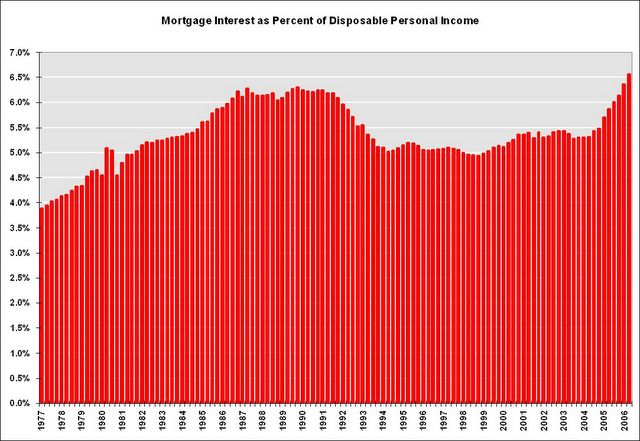 This calculation is similar to the FED's Financial Obligations Ratio (FOR) except this is only for the mortgage interest payment. The current ratio is at an all time high, breaking the record set during the previous housing boom in the late '80s. The ratio will probably continue to go higher since rates are increasing and there are a substantial number of ARMs that will adjust over the next couple of years.
Sunday, July 30, 2006
Goldman Sachs on Housing Prices
by Calculated Risk on 7/30/2006 11:37:00 PM
The Business Online reports: Fears as US house prices to dip for the first time ever
HOUSE prices are set to drop in the US for the first time on record, US investment bank Goldman Sachs warned this weekend.
Prices in several segments of the market have already started to fall, and the overall market will move into the red even in nominal terms next year, fuelling fears that this will trigger a downturn in consumer spending and hit an already slowing US economy.
Jan Hatzius, economist at Goldman Sachs, said: “The risk is rising that nominal US home prices may be headed for an outright decline in 2007. It would be the first decline in national home prices ever recorded, at least in nominal terms.”
In real terms, prices have declined during several periods, including a 9% drop from 1979 to 1984.
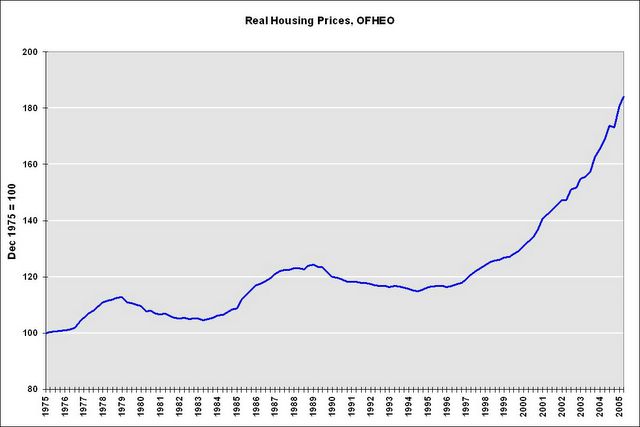
Click on graph for larger image.
This is a graph of the OFHEO real House Price Index adjusted by CPI less shelter. Real prices fell 7.2% from 1979 to 1984. From 1989 to 1995, real prices fell 7.9%.
UPDATE 1: Hatzius used the core PCE deflator and I used CPI less shelter. That is why there is a small difference between the calculations.
The Office of Federal Housing Enterprise Oversight’s index is also likely to show a sharp slowdown for the rest of this year. As of the first quarter of 2006, this index was up 10.1% year-on-year, extremely close to the 10.4% year-on-year increase seen in the National Association of Realtors median-price data.UPDATE 2: Hatzius used the Purchase Only Index that shows a 10.1% YoY increase (see page 6). The OFHEO HPI shows a YoY 12.54% increase (see third page). The nominal quarterly apprection was 2.03%.
Goldman is forecasting that the year-on-year Office of Federal Housing Enterprise Oversight’s index growth could fall to 4% by the second or third quarter of 2006, and possibly into negative territory in 2007.
UPDATE 3: I wrote: Based on OFHEO's method, there is almost no way the year-on-year "index growth could fall to 4% by the second or third quarter of 2006".
Hatzius suggests:
"If you assume roughly flat seasonally adjusted numbers for Q2 and Q3, I calculate the year-on-year rate would drop to 4.2% by Q3. Also, you could get some downward revisions to prior quarters, which would also work in the direction of pushing down the yoy rate."Using the Purchase Only Index, and if Q2 and Q3 are flat (very possible), and there are no revisions, the YoY increase would be 6.95% in Q2 and 4.2% in Q3. So Hatzius' estimate is very possible for Q3, even without any downward revisions. Using the HPI with the same assumptions, Q2 would be 8.6%.
The underlying purchase-only and a seasonally-adjusted purchase-only index can be downloaded here. I agree that we will be seeing both real and nomnal price declines soon.
Will Business Investment Rescue the Economy?
by Calculated Risk on 7/30/2006 09:35:00 PM
In the comments to the previous post, Kett82 reads this NY Times article: Housing Slows, Taking Big Toll on the Economy, and then asks:
What is the basis for saying that corporate spending is increasing? I thought the most interesting thing about the Friday’s Commerce Dept GDP report was that corporate spending actually fell by 1.0%.The BEA divides investment spending into Nonresidential and Residential categories. Nonresidential investment includes Structures (spending increased at 12.7% annual rate in Q2) and Equipment and software (decreased at 1.0% annual rate as Kett82 noted). I'm going to combine both categories of nonresidential investment.
The following two graphs show residential and nonresidential investment: the first as a percent of GDP, the second in chained 2000 dollars.

Click on graph for larger image.
This graph shows the slump in nonresidential investment following the bursting of the stock bubble. During the same period, residential investment increased until very recently.
Nonresidential investment has started to increase as a percent of GDP.
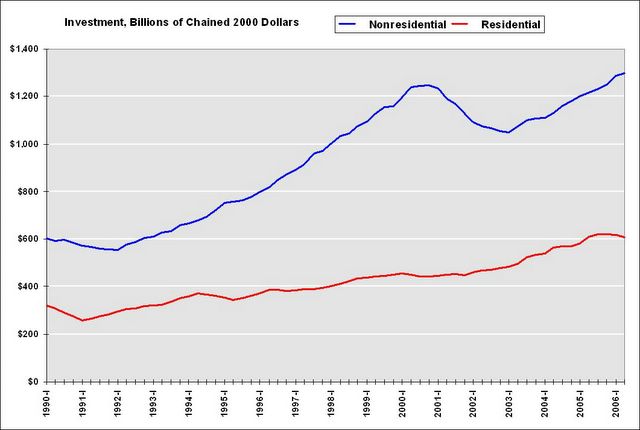
The chained 2000 dollars graph shows the significant pickup in nonresidential investment, in real terms, over the last three years. The reason the blue line appears steep is primarily because the price of software has continued to fall.
I prefer the first graph (percent of GDP). Nonresidential investment, as a percent of GDP, has to increase rapidly to "rescue the economy" from the impact of falling residential investment and a slowdown in consumer spending.
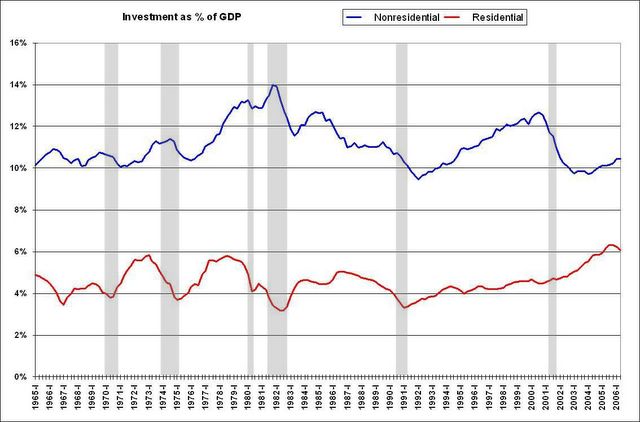
This is a longer term graph of investment as a percent of GDP. The shaded areas are recessions.
Falling residential investment has been an excellent leading indicator for consumer led recessions.
The most recent recession was due to a fall in nonresidential investment. The '90s recession was led by a decline in both types of investment. But for most consumer led recessions, nonresidential investment was still increasing when the recession started.
As an aside, the Great Depression saw a dramatic decline in both nonresidential and residential investment. Nonresidential investment fell 77% from '29 to '33 and residential investment fell 85% over the same period.
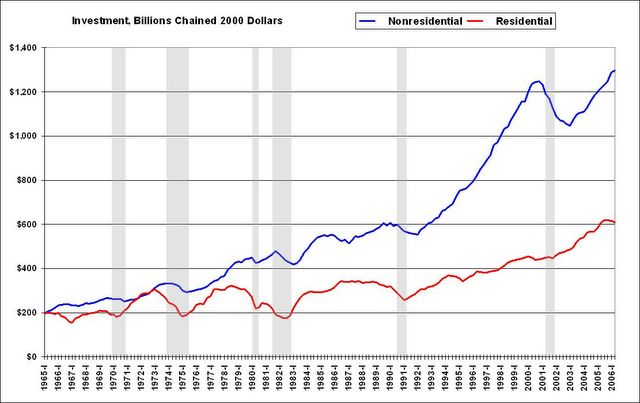
This is a graph of chained 2000 dollars investment spending and recessions.
Although the graph looks a little different (because of falling software prices), it shows that increases in nonresidential investment have not saved the economy when residential investment starts to fall.
From a historical perspective, it doesn't seem likely that business investment will rescue the economy. Kett82 also linked to this AP story: Business spending could bail out economy
Worries about rising oil prices and a cooling housing market may be crimping consumer spending, but some experts bet businesses are poised for a burst of buying.This level of cash provides some hope for increased business investment. However I'm not so certain that companies "have relatively low debt" (I need to do some digging), and historically companies have cut their investment spending in response to economic slowdowns. (See graphs 3 and 4).
The premise rests on this: Companies are flush with cash, have relatively low debt and are racking up huge profits, so it's the right time for them to build and expand factories and upgrade technology systems.
Standard & Poor's reports that the S&P industrials--the S&P 500 minus financials, utilities and transportation issues--are sitting on roughly $633 billion in cash.
Maybe business investment will offset the drop in residential investment and the slowdown in consumer spending, but I wouldn't bet on it.

UPDATE: Here is Total Nonfinancial Business Debt as a Percent of GDP from the Flow of Funds report (see D.3 Debt Outstanding by Sector)
Note: Graph starts at 40% to better show variation.
By other measures, like cash and cash equivalents to total liabilities, business cash positions are solid, but not spectacular.
The phrase "relatively low debt" depends on relative to what. Compared to the debt increases by Households and the Federal Government, nonfinancial business debt hasn't grown much - but it is still at close to record levels. With lower interest rates, business debt service is certainly below record levels (unlike household debt service that sets a new record every quarter). Still, with rising rates and a slowing economy, I don't think business cash levels are the economy's Life Preserver.
Friday, July 28, 2006
Residential Investment Slump: We Ain't Seen Nothin' Yet
by Calculated Risk on 7/28/2006 10:09:00 PM

Click on graph for larger image.
This graph shows annual Residential Investment, in 2000 dollars, since 1976.
2006 is an average of the first two quarters.
In the previous post, I graphed quarterly Residential Investment as a percent of GDP since 1987. This graph shows a decline over the last two quarters, but if this decline in Residential Investment is similar to the previous busts (early '80s and early '90s) then ...
We ain't seen nothing yet!
The early '80s and early 90's busts saw declines of 40% and 25% in Residential Investment respectively. So far, the current decline is about 2% from the quarterly peak of 2005.
Also, it appear residential construction employment closely follows real residential investment with a several quarter lag. If residential investment continues to fall (very likely), then residential construction employment should start decreasing in the 2nd half of 2006. Unfortunately the data series are limited - the data series for residential building started in 1985 and residential specialty contractors in 2001.
Currently there are 3.323 million people employed in residential construction in the U.S. according to the BLS. If the current bust is similar to previous Residential Investment busts, reported residential construction employment might decrease by 800K to 1.3 Million over several years. Actual employment will probably fall even more if there is a substantial underground "cash" economy involved in construction - something I think is likely.
And this is just the impact on residential construction employment. Add in the employment impact on mortgage brokers, RE agents, escrow and title workers, and peripheral employment (like Home Depot, building suppliers, etc.) and the drag on employment over the next few years could be substantial.
Also many of these housing related jobs are relatively high paying with low education requirements, therefore the current job holders might have difficultly finding new jobs with similar pay.
And I haven't even addressed the impact on the consumer from the loss of MEW.
GDP, Residential Investment and Savings
by Calculated Risk on 7/28/2006 10:46:00 AM
The BEA released the Advanced Q2 GDP report this morning.
From Dean Baker: Weakening Housing Market Slows Economy
GDP growth fell to 2.5 percent in the second quarter as consumption growth slowed and housing investment fell sharply. Equipment investment also declined for the first time since the first quarter of 2003. While the growth data is somewhat worse than expected, the report also provides evidence that inflationary pressures are increasing.Here is residential investment as a percent of GDP:
The weak consumption growth is directly related to the weakness in the housing market. Consumers have borrowed heavily against the growing equity in their homes over the last four years, as the savings rate declined from 2.9 percent in the first quarter of 2002 to -1.5 percent in the second quarter of 2006. This drop in savings translated into more than $400 billion in consumption growth over this period. Now that housing prices have stopped rising, and may even be falling in real terms, consumers are losing the ability to borrow further against their homes. This means that the savings rate is unlikely to slide still further into negative territory. As home prices weaken, the savings rate will begin to rise to more normal levels, and consumption growth will trail income growth. If job growth and real wage growth remain weak, then this implies that consumption will grow very slowly or even decline.
Click on graph for larger image.
According to the BEA, the decline in Residential Investment dragged GDP down 0.4% in the 2nd quarter. Recent evidence suggests this "drag" will increase and will probably last for some time.
And the decline in Residential Investment is just the beginning of the impact of housing on GDP. In the second half of 2006, construction employment will probably start to fall, leading to a drag on employment growth and consumer spending.

And, as Dr. Baker noted, the savings rate has gone negative as homeowners have borrowed against their homes to maintain their lifestyle. As housing prices stabilize or decline, MEW (Mortgage Equity Withdrawal) will also decline. This will impact consumption expenditures.
UDPATE: Add graph of Core PCE inflation rate:

The Core PCE (Personal consumption expenditures excluding food and energy) increased at a 2.9% annual rate in Q2. Core PCE is rumored to be one of the FED's favorite inflation measures. This is the largest quarterly percentage increase in core PCE since 1994!
A slowing economy and rising inflation pressures - overall this is a negative report.
Thursday, July 27, 2006
An Evolving View of the Housing Market
by Calculated Risk on 7/27/2006 10:12:00 PM
Mish provides a series of posts from a real estate broker based in Atlanta (Sonnypage on Motley Fool): Lights Out in Georgia. A sample:
Jan 30, 2006:
Our business here on Atlanta's north side is very strong. We have four contracts year to date, we will get number five this week. This compares with twenty six closings in 2005, so we are clearly off to a strong start.July 20, 2006:
...
All of which leaves me free to make my biggest and strongest Sonnypage prediction ever. This time next year, I will still be making money hand over fist, and Mish and Gary Shilling and the rest of the doomsday crowd will still be pumping the next depression.
It's been a "character building year" as another agent in our office put it the other day. What makes it more stunning, at least to me, is that it started out so well. We ended the first quarter with nine deals pending or closed, which is a very solid start. Then we hit a brick wall with only three deals in the second quarter and that would make it our worst second quarter ever in our twelve years.There is much more.
Then it got worse.
New Home Sales and Recessions
by Calculated Risk on 7/27/2006 06:36:00 PM
Updated by popular demand ...

Click on graph for larger image in new window.
The gray columns are economic recessions as defined by NBER.
For consumer led recessions (all but the most recent recession in 2001), New Home Sales were falling prior to the onset of the recession. It appears that New Home Sales peaked last year.
This doesn't imply a cause and effect relationship, but it is something to watch. If New Home Sales can stay above 1.1 million or so that probably increases the probabilities of a soft landing (just slower growth), as opposed to a hard landing (a recession).
New Homes Sales Revisions
by Calculated Risk on 7/27/2006 04:21:00 PM
UPDATE: I've checked more data, and historically revisions can go either way - although negative revisions are more common, especially recently.
As Ed Hopper and Robert Coté mentioned in the comments of the previous post, the New Home Sales number has been consistently revised downwards. I usually note this every month.
Click on graph for larger image.
This graph shows the initial release estimate for New Home Sales (red) followed by the three revisions.
This pattern can also be seen in data for 2004 and 2005 (I haven't checked all data). For whatever reason, the initial release typically overstates New Home Sales - and it is reasonable to guess that the final number (after three revisions) will be around 5% less than the initially reported number.
The final number for June will probably be close to 1.075 Million, a decrease of 14.5% from June 2005, and the lowest June since 2002.
June New Home Sales: 1.131 Million Annual Rate
by Calculated Risk on 7/27/2006 10:04:00 AM
UPDATE: Dr. Hamilton has an excellent post on Seasonal adjustment and new home sales.
According to the Census Bureau report, New Home Sales in June were at a seasonally adjusted annual rate of 1.131 million. Sales for May were revised down to 1.166 million.
Click on Graph for larger image.
Sales of new one-family houses in June 2006 were at a seasonally adjusted annual rate of 1,131,000 ... This is 3.0 percent below the revised May rate of 1,166,000 and is 11.1 percent below the June 2005 estimate of 1,272,000.
The Not Seasonally Adjusted monthly rate was 103,000 New Homes sold. There were 115,000 New Homes sold in June 2005.
On a year over year basis, June 2006 sales were 10.4% lower than June 2005. Also, June '06 sales were slightly below June 2004 (105,000) and June 2003 (107,000) sales.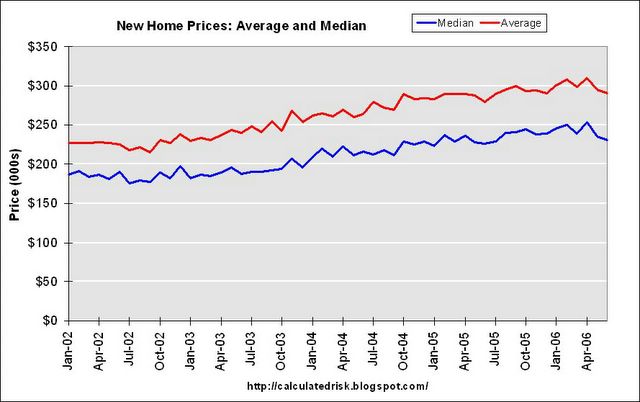
The median and average sales prices were down slightly. Caution should be used when analyzing monthly price changes since prices are heavily revised.
The median sales price of new houses sold in June 2006 was $231,300; the average sales price was $290,600.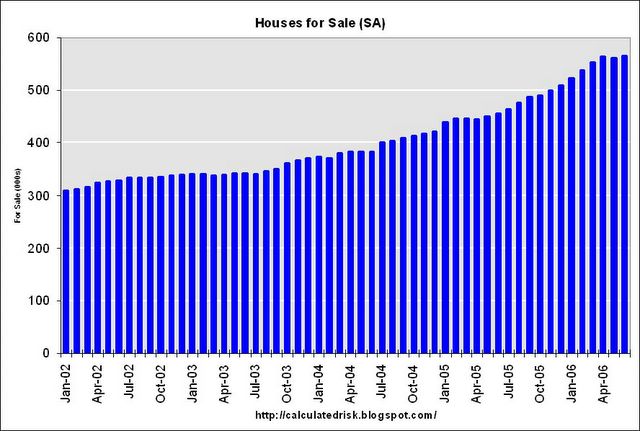
The seasonally adjusted estimate of new houses for sale at the end of June was 566,000. This represents a supply of 6.1 months at the current sales rate.
The 566,000 units of inventory is another record for new houses for sale. 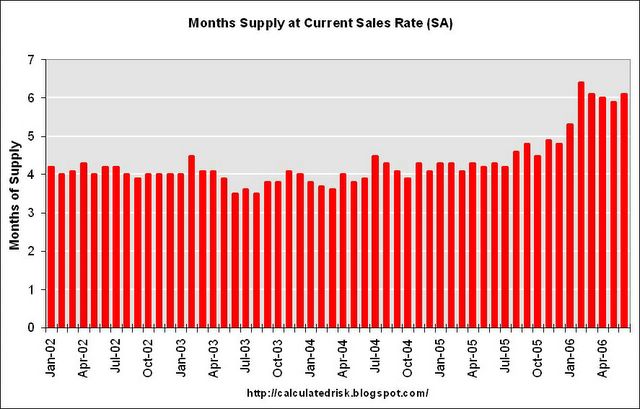
On a months of supply basis, inventory is above the level of recent years.
This report appears stronger than expected based on recent reports from home builders, but the report is slightly weaker than expected by Wall Street estimates.
I suppose this shows that the housing slowdown is orderly - so far.
Wednesday, July 26, 2006
Economic Pessimism Grows
by Calculated Risk on 7/26/2006 06:14:00 PM
The American Research Group has a recent poll on the economy. Here are a few key numbers:
57% say the national economy is getting worse
47% of Americans say their personal financial situations are getting worse
38% of Americans say they believe that the national economy is in a recession

Click on graph for larger image.
We need to be cautious with these results; some academic research has shown that there is very little predictive power in this type of poll. Dr. Dean Croushore said:
"... consumer confidence just reflects the past. You lose your job, your confidence falls. There's not really anything new there. What we really want are indicators that look forward."My guess is those that think the economy will be worse next year are just reflecting current difficulties, primarily gas prices. As an example, when gas prices spiked last year after the hurricanes, those expecting a worse economy in 2006 also increased.
But look at those thinking the economy will improve next year. Only 5% of those polled!
I think this shows consumer psychology is changing. This isn't a "contrary indicator" - growing pessimism leads to consumers pulling back on their spending, and it can become a self-fulfilling prophecy.
Something needs to change or we may see a recession. Maybe gas prices will fall, or real wages start to rise, but clearly the weakening economy is impacting the economic outlook of Americans.
Pulte quarterly earnings and orders tumble
by Calculated Risk on 7/26/2006 05:28:00 PM
Although I don't mention every home builder, Pulte is #2 in the U.S., so ... Reuters reports: Pulte quarterly earnings and orders tumble
Pulte Homes Inc., the No. 2 U.S. home builder, on Wednesday said its quarterly profit fell 20 percent and new orders dropped 30 percent, underscoring the slowdown in the U.S. housing market.Pulte had already warned, so this isn't a big surprise. From the Pulte PR:
"Our second quarter results reflect the changing dynamics being experienced in the homebuilding industry," said Richard J. Dugas, Jr., President and CEO of Pulte Homes. "After several years of limited house inventory and robust demand, the supply of homes for sale continues to increase, while greater buyer uncertainty about purchasing a home at this time is being further impacted by their inability to sell existing homes and the effect higher prices and interest rates are having on overall affordability.UPDATE: Here is a list of the top U.S. home builders, the 2005 Top 10: D. R. Horton, Pulte Homes, Lennar, Centex, KB Homes, Beazer Homes, Hovnanian Enterprises, Ryland Group, M.D.C. Holdings, NVR. I've mentioned Standard Pacific before (#11) and Toll Brothers (#14). I currently have no position in any home builder.
"We continue to adjust key business tactics to effectively meet the more challenging operating environment we face in many markets today.
UPDATE 2: Quotes of the day from: Mortgage lenders grapple with deflating housing bubble
"I've never seen a soft-landing in 53 years, so we have a ways to go before this levels out," Countrywide Chief Executive Officer Angelo Mozilo said on a Tuesday conference call. "I have to prepare the company for the worst that can happen."
...
Countrywide's Mozilo said. "The only thing that's really holding back the dam now is that we have good employment numbers."
More on Casual Dining
by Calculated Risk on 7/26/2006 04:13:00 PM
Applebee's just missed:
System-wide domestic comparable sales for the second quarter of 2006 decreased 1.8 percent.Notice that the results are trending down: sales decreased 1.8% for the quarter, 3.0% for June, and 3.6% for July.
...
The company also reported comparable sales for the June fiscal period, comprised of the five weeks ended June 25, 2006. System-wide domestic comparable sales decreased 3.0 percent for the June period.
...
In addition, the company reported comparable sales for the July fiscal period, comprised of the four weeks ended July 23, 2006. System-wide domestic comparable sales decreased 3.6 percent for the July period
...
Lloyd Hill, chairman and chief executive officer, said, "We are disappointed that our efforts to broaden our reach have been masked by the challenging consumer spending environment. As we are uncertain as to when the environment will start to improve, we are taking a more conservative view in our outlook for the remainder of the year." emphasis added.
Casual dining is a discretionary expense and is frequently one of the first espenses that consumers reduce during hard times. Add APPB to the list in the previous post.
UPDATE: Also impacted by the housing and consumer slowdown: Housing slowdown hits Black & Decker profits
On a conference call with analysts Wednesday, officials said the drop in retailer and consumer demand for some home improvement products provided further evidence of a housing slowdown.
Beige Book: Consumer Spending and Housing
by Calculated Risk on 7/26/2006 02:07:00 PM
The Federal Reserve has release the Beige Book. Here are a few excerpts on consumer spending and housing:
Many reports indicated that consumer spending on retail goods weakened slightly during the survey period. Although most Districts reported gains in retail sales compared with a year earlier, they generally characterized the pace of growth as modest or disappointing. Retail sales were "mixed" or "varied" in Boston, New York, and Atlanta, "flat" in Richmond, "cooling" in Dallas, and "below expectations" in Chicago and San Francisco.Looking at specific companies, UPS "Slower growth forecast hits UPS shares" is struggling, boat sales are off at Brunswick and others, "Brunswick Cuts Yearly Guidance on Weak Sales", casual dining is getting hit (see P.F.Chang, EAT "Chili's", Cheesecake Factory, and more). These are all signs of a retail slowdown. Notice that MacDonalds is doing OK - a classic "inferior good".
Most Districts reported that sales gains for department stores and smaller retail establishments were limited or below retailers' expectations. Sales were healthy for luxury retailers but relatively weak among "big box" retailers and other low-price outlets. Cleveland and Chicago reported that general retail spending was held down in part by high gas prices, which have squeezed households' budgets and reduced the frequency of shopping trips.
In general, sales of automobiles and light trucks were flat to down. Sales remained healthier for imported vehicles than for domestic makes despite the revival of sales incentives for the latter, as high gas prices continued to nudge buyers towards fuel-efficient models. Inventories reportedly were undesirably high for SUVs and light trucks in some areas.
On housing:
With only scattered exceptions, Districts reported slower activity in residential real estate markets. For new and existing homes, available reports indicated that the pace of sales declined and that the inventory of available homes and time on the market rose in most major metropolitan areas nationwide. Slower sales activity has translated into more limited price gains, and residential construction activity has fallen in most Districts as well.
The St. Louis and Dallas Districts were exceptions to the general slowdown in residential market activity. In the St. Louis District, the pace of home sales was largely unchanged or up slightly compared with a year earlier, although residential construction slowed there. Housing markets have remained resilient in the Dallas District, where despite signs of cooling, "home demand remains strong" and residential building activity has been "robust."
As home demand has slipped more generally, scattered reports indicated a strengthening in demand for rental units. New York reported that the market for apartment rentals has been tightening in Manhattan, and according to Atlanta slower condominium sales in Florida have prompted owners to convert some units to rental property.
MBA: Mortgage Application Volume Declines
by Calculated Risk on 7/26/2006 09:14:00 AM
The Mortgage Bankers Association (MBA) reports: Application Volume Declines Slightly
Click on graph for larger image.
The Market Composite Index, a measure of mortgage loan application volume, was 533.8, a decrease of 1.3 percent on a seasonally adjusted basis from 540.8 one week earlier. On an unadjusted basis, the Index decreased 1.2 percent compared with the previous week but was down 28.2 percent compared with the same week one year earlier.Mortgage rates decreased:
The seasonally-adjusted Purchase Index decreased by 2.4 percent to 389.0 from 398.5 the previous week and the Refinance Index increased by 0.6 percent to 1385.2 from 1377.6 one week earlier.
The average contract interest rate for 30-year fixed-rate mortgages decreased to 6.69 percent from 6.73 percent...Change in mortgage applications from one year ago (from Dow Jones):
The average contract interest rate for one-year ARMs decreased to 6.25 percent from 6.28 percent ...
| Total | -28.2% |
| Purchase | -19.0% |
| Refi | -40.3% |
| Fixed-Rate | -27.3% |
| ARM | -30.2% |
The MBA also noted:
The seasonally adjusted Purchase Index ties the three year low that was observed five weeks ago.
Purchase activity is off 19.0% compared to the same week last year. This may be the beginning of
Tuesday, July 25, 2006
Foreclosure filings in Mass. jump 66%
by Calculated Risk on 7/25/2006 10:27:00 AM
The Boston Globe reports: Foreclosure filings in Mass. jump 66%

Foreclosure filings in Massachusetts increased 66 percent in the second quarter, according to data released yesterday, a trend that is expected to continue over the next year.
Mortgage lenders filed 4,292 notices of foreclosure against homeowners during the second quarter, up from 2,585 a year earlier, according to ForeclosuresMass Corp., which compiles the data from Massachusetts Land Court. That 66 percent surge in filings compares with a 30 percent rise in first-quarter filings.
The state's rate of past-due mortgages -- the number of homeowners more than 30 days behind in their payments, as a percent of total mortgages -- is 3 percent, compared with 4 percent nationwide, according to the Mortgage Bankers Association. Lenders have filed for foreclosure on 0.6 percent of Massachusetts mortgages, below the 1 percent national rate.
But, Jeremy Shapiro, the president of ForeclosuresMass, said he was alarmed about the pace of Massachusetts' sharp recent increases.
``The foreclosures in Massachusetts right now are skyrocketing," he said. ``This is a problem that's going to extend through 2007 and 2008."
NAR: Existing-Home Sales Flattening, Prices Cooling
by Calculated Risk on 7/25/2006 09:44:00 AM
The National Association of Realtors (NAR) reports: Existing-Home Sales Flattening, Prices Cooling 
Click on graph for larger image.
Existing-home sales were down modestly in June, and home prices were up slightly from a year ago, according to the National Association of Realtors®.
Total existing-home sales – including single-family, townhomes, condominiums and co-ops – declined 1.3 percent to a seasonally adjusted annual rate1 of 6.62 million units in June from an upwardly revised level of 6.71 million May. Last month’s sales were 8.9 percent below the 7.27 million-unit pace in June 2005.
David Lereah, NAR’s chief economist, said the housing market is flattening-out. “Over the last three months home sales have held in a narrow range, easing to a level that is near our annual projection, which tells us the market is stabilizing,” he said. “At the same time, sellers have recognized that they need to be more competitive in their pricing given the rise in housing inventories. Home prices are only a little higher than a year ago.”
The national median existing-home price2 for all housing types was $231,000 in June, up 0.9 percent from June 2005 when the median was $229,000. The median is a typical market price where half of the homes sold for more and half sold for less.
“The change in price performance is directly tied to housing inventories – a year ago we had a lean supply of homes and a sellers’ market, with monthly home sales at an all-time record high,” Lereah said.
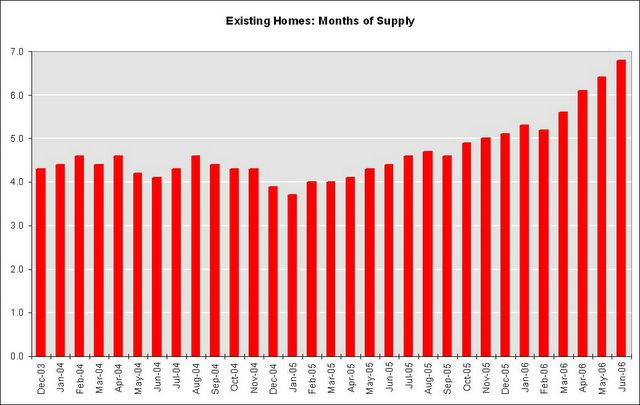
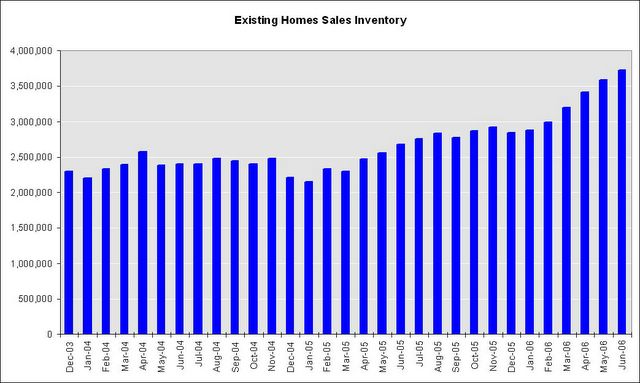
Total housing inventory levels rose 3.8 percent at the end of June to 3.73 million existing homes available for sale, which represents a 6.8-month supply at the current sales pace. By contrast, in June 2005, there was a tight 4.4-month supply on the market.Existing Home Sales are a trailing indicator. The sales are reported at close of escrow, so June sales reflects agreements reached in April and May.
As I've noted before, usually 6 to 8 months of inventory starts causing pricing problem - and over 8 months a significant problem. Current inventory levels, at 6.8 months of supply, are now in the danger zone.
Monday, July 24, 2006
FDIC: Breaking New Ground in U.S. Mortgage Lending
by Calculated Risk on 7/24/2006 03:39:00 PM
From the FDIC Summer Outlook 2006: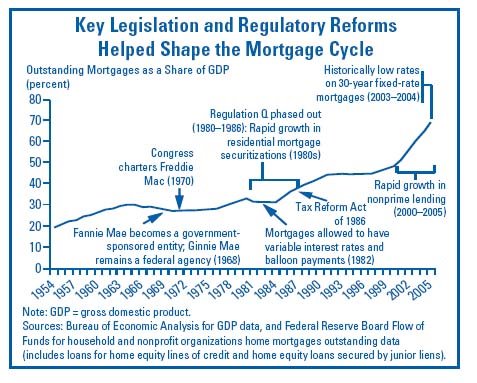
[Mortgage lending] growth has not come without risk. Widespread marketing of nontraditional products could be raising the risk profile of some mortgage lenders and consumers. Growing unease about risk taking by lenders and consumers recently led bank regulators to propose new supervisory guidelines on risks of, and disclosures for, various mortgage products.Looking at the first chart, it appears the boom happened during a period of historically low interest rates and a rapid increase in non-prime lending.
This article examines historical developments in mortgage loan volume and underwriting trends. It also assesses the significance of recent market and institutional innovations in light of historical trends, reviews mortgage loan performance trends, discusses the role of regulation, and considers the near-term outlook for the mortgage lending cycle.

Since 2003, strong home price appreciation and declining affordability have helped drive growing demand for nontraditional mortgage products that can be used to stretch home-buying power. Aided by new computer models and an easing in lending standards, many lenders have accommodated this demand by expanding
the variety of nontraditional mortgage products offered while also extending loans to borrowers with less-than stellar credit histories. As a result, by 2005, nonprime
lending, comprised of subprime and Alt-A (low- or nodocumentation) loans, accounted for about 33 percent of all mortgage loan originations, up from almost 11 percent in 2003.
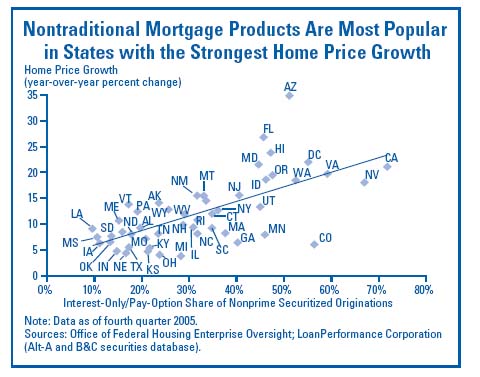
Rapid growth also has occurred among some of the higher-risk mortgage alternatives within the nonprime arena. As recently as 2002, IOs and pay-option ARMsThere is much more in the FDIC outlook.
represented only 3 percent of total nonprime mortgage originations that were securitized. However, the IO share of credit to nonprime borrowers has soared during the past two years to 30 percent of securitized nonprime mortgages, while the pay-option product jumped to a similar share in less time (see Chart).
Furthermore, the low- or no-documentation share of subprime lending has grown significantly since 2001, from about 25 percent to just over 40 percent.
Saturday, July 22, 2006
Putting off the Mortgage Pain, Until ...
by Calculated Risk on 7/22/2006 08:51:00 PM
These two articles fit together - first, from the NY Times: Re-refinancing, and Putting Off Mortgage Pain
It is the latest twist in the gravity-defying world of the high housing prices and exotic low-rate mortgages: As monthly payments on adjustable-rate mortgages are starting to balloon, many Americans have found a way to put off the day of reckoning.And from the WSJ: New Headache For Homeowners: Inflated Appraisals
They are refinancing with new adjustable-rate mortgages that keep monthly payments low — for now, that is, though their payments are likely to rise even higher in the future.
"Now it's pay-the-piper time for people, and they're finding out they don't have the value in the house they thought they had," says John Taylor, president of the National Community Reinvestment Coalition, a Washington-based nonprofit that supports low-income housing.And back to the NY Times:
Karen Ammon, who works for an auto-parts marketing company in Bloomfield Hills, Mich., bought her home in 2002 for $141,000. A year later, a lender encouraged her to refinance into a larger loan that would let her pay off credit-card debt. The appraiser chosen by the lender had great news: Her house was now valued at $175,000. She had room to raise her total mortgage borrowings to $165,000.
Now monthly payments on the adjustable-rate loan she received in 2003 are rising in line with the general level of interest rates. So Ms. Ammon wants to refinance into a fixed-rate loan. But when she tried to refinance, she couldn't do so because several appraisers valued her home at around $148,000 -- or about $15,000 less than she owes in mortgage debt.
For now, this mini-refinancing boom is assuaging fears that rising interest rates and higher monthly payments would drive some borrowers into foreclosure or force them to scale back sharply on other spending. As a result, consumer spending may hold up better than some economists had thought.I expect that most homeowners will "put off the day of reckoning" for as long as possible. The result, for the housing market, is each year another group of homeowners will find themselves upside down and desperately need to sell.
But the refinancing also represents a doubling-down on a bet that housing prices will continue to rise on the West and East Coasts and in other hot markets. If the value of the home falls closer to the amount of the loan, that could curb the ability to refinance, and may prompt the homeowner to either invest more in the home or to sell it.
Instead of a surge of inventory over just a year or two due to balloning payments, homeowners will refinance, if they can, and there will be a steady supply of inventory over several years - prolonging the housing bust.
WSJ: For-Sale Signs Multiply, Prices Slip
by Calculated Risk on 7/22/2006 12:17:00 AM
The WSJ reports: For-Sale Signs Multiply Across U.S. As Supplies Rise and Prices Slip
The housing market continues to weaken in much of the country as inventories of unsold homes rise and many sellers cut their asking prices, a quarterly survey by The Wall Street Journal shows.Prices "edging down" is exactly what I expect - not a "broad collapse of housing prices". I also expect inventories to continue to rise.
There is no sign of a broad collapse of housing prices about a year after the once-hot coastal markets entered a long-anticipated cooling phase. But the general level of prices is edging down in some areas and leveling off in others, while the supply of homes for sale keeps rising.

Source: WSJ Online
"I do think we're going to see some tougher times ahead," says Scott Anderson, senior economist at Wells Fargo & Co. in Minneapolis. By August, he says, most cities in California will be showing modest declines from a year earlier in home prices, and prices also may decline further in parts of Florida, Nevada, Arizona and the Northeast.The language has definitely changed. The chief economist for CAR no longer feels comfortable with the term "soft landing" and now the Wells Fargo senior economist is talking about the market stabilizing in "late 2007".
Headlines about falling prices could make buyers more aggressive in negotiating and persuade some sellers to "get out with what they can," Mr. Anderson says.
Mr. Anderson expects the current downswing to last into next year; by late 2007, he thinks the market will be stabilizing.
Friday, July 21, 2006
California: Housing Sales off 16% from 2005
by Calculated Risk on 7/21/2006 02:58:00 PM
DataQuick reported total California June Home Sales.
"A total of 53,700 new and resale houses and condos were sold statewide last month. That's up 3.8 percent from 51,750 for May and down 20.7 percent from 67,750 for June 2005."

Click on graph for larger image.
Here are the monthly sales in California for the last 3 years (Source: DataQuick)
Sales for 2006 have fallen 15.7% year-to-date compared to 2005.
In the previous post, the LA Times mentioned the current California Association of Realtors (CAR) forecast is for a "16.8% drop" in existing sales. With sales slowing even more over the last 3 months (off almost 20% compared to 2005), that revised prediction might prove to be too optimistic.
California Assn. of Realtors: Not 'Soft Landing'
by Calculated Risk on 7/21/2006 11:38:00 AM
David Streitfeld writes in the LA Times: Housing Expert: 'Soft Landing' Off Mark. Excerpts:
The chief economist of the California Assn. of Realtors has stopped using the term "soft landing" to describe the state's real estate market, saying she no longer feels comfortable with that mild label.On Real Estate agents, just see my previous post!
...
For real estate optimists, the phrase "soft landing" conveyed the soothing notion that the run-up in values over the last few years would be permanent. It wasn't a bubble, it was a new plateau.
The Realtors association last month lowered its 2006 sales prediction from a 2% slip to a 16.8% drop. That was when Appleton-Young first told the San Diego Union-Tribune that she didn't feel comfortable any longer using "soft landing."
...
If there's one group in California still unreservedly bullish on real estate, it might be the throngs lining up to take the licensing exams.
The state Department of Real Estate recently reported that the total number of agents in the state passed 500,000 in May for the first time. That's one agent for every 55 adults in the state.
Appleton-Young had no qualms about predicting a hard landing here: "We're expecting a fairly significant shakeout."
Thursday, July 20, 2006
California: Real Estate Licensees Surpasses 500,000
by Calculated Risk on 7/20/2006 11:55:00 PM
The California Department of Real Estate reports the total number of Real Estate licensees reached 504 thousand in the state at the end of June 2006. This is an increase of 55,000 agents / brokers over the last 12 months.

Click on graph for larger image in new window.
The number of Salesperson licensees has reached 336.7 thousand, a 14% increase over one year ago.
The number of Broker licensees is 137.4 thousand; 8% higher than last year.
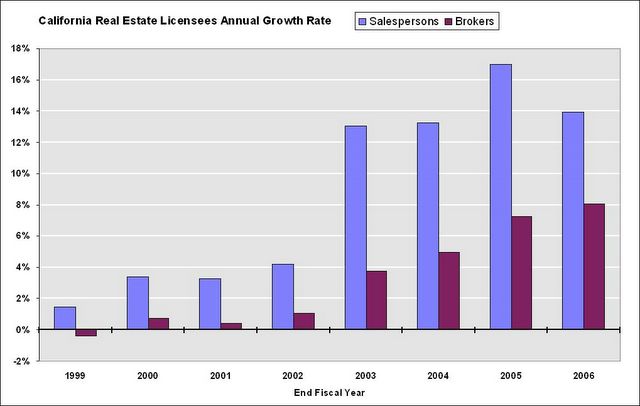
The second graph shows the annual growth rate for the number of salesperson and broker licensees.
In California, the number of real estate transactions peaked last year, but the number of licensees continues to grow.
Husing: Soft Landing for Inland Empire Housing
by Calculated Risk on 7/20/2006 07:48:00 PM
Private economist Dr. John Husing is quoted in the San Bernardino Sun: Husing still optimistic
There's just too strong an economy and too much job growth for much other than the "soft landing'' Husing and other economists have been predicting for the end of the five-year housing boom.
"We are right on the cusp of a very powerful period in job growth,'' Husing said. "Local [Inland Empire, San Bernardino/Riverside area] unemployment in May was 4.2 percent, and that's the lowest I have seen for May in 42 years of studying the local economy.
...
Senior economist Christopher Thornberg of UCLA's Anderson School of Management had called the soft-landing theory "nonsense'' on Tuesday and said we are in a "classic bubble.''
"If we are lucky, prices will go flat,'' he said, suggesting that we could see five years without price appreciation.
That may be true elsewhere, Husing said, but it won't happen here.
"Is the housing market vulnerable?'' he asked. "Yes, it is. But is a bubble likely to happen? No, it is not. The underlying strength of our economy is too great.''
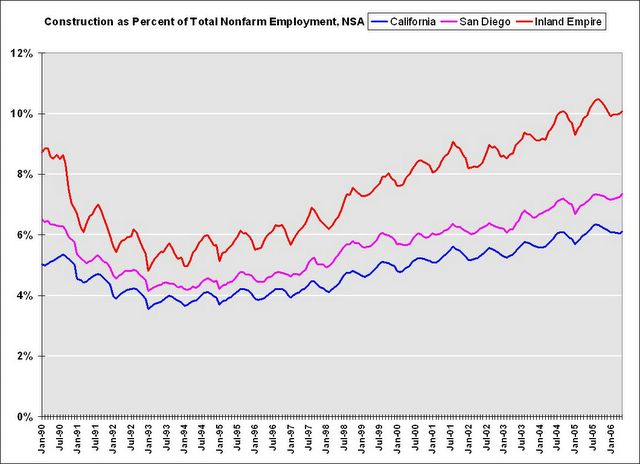
Click on graph for larger image.
I disagree with Dr. Husing. I think the Inland Empire is one of the most vulnerable areas to a housing slowdown. Construction is far more important to the San Bernardino/Riverside economy than most other areas of the state.

As the homebuilders start to layoff workers, a larger percentage of workers in the San Bernardino and Riverside area are at risk. During the previous housing bust, the Inland Empire unemployment rate rose from 4.9% to over 12% (NSA) in just three years.
With regards to timing, I noted earlier:
Historically Construction Employment continued to rise for a year or more after the peak in housing transactions.So I expect construction employment in the Inland Empire to start to fall during the next couple of quarters.
UPDATE: DoD Employment as Percent of Nonfarm Employment.

A common question is: how much did the aerospace / DoD spending slowdown in the early '90s impact employment? Although I don't have aerospace data (I'll look), this graph shows DoD employment was far more important for San Diego than the Inland Empire.
DoD and aerospace were probably most important for LA and San Diego in the '90s
Note that DoD employment was far less than construction employment. Also, DoD employment only fell slightly faster than total employment in the early '90s. Construction employment fell sharply. DoD employment was fairly flat during the mid-90s, so the percentage of total employment continued to fall as the California economy added jobs.
Although the aerospace slowdown probably precipitated the general economic slowdown in California during the early '90s, the housing slowdown had a larger impact. This time, many of us are suggesting that the housing slowdown will most likely be the precipitating event.
Thornberg: Housing a "Classic Bubble"
by Calculated Risk on 7/20/2006 01:32:00 AM
UCLA Economist Christopher Thornberg is quoted in the San Bernardino Sun: Region's home sales looking like 'classic bubble'
"The soft-landing people are full of nonsense," said Christopher Thornberg, senior economist at UCLA. "This is a classic bubble. And unit sales are falling faster than in past bubbles."I think Thornberg is optimistic.
"We are in the middle of this decline. If we are lucky, prices will go flat. But we are not going to have prices fall like the stock market. You won't see declines of 10 percent or 15 percent per year. What will happen is that prices will flatten out," he said, adding that there might not be housing appreciation until 2011.
Next year will be critical from the standpoint of how the consumer will react to not having "a house cash machine" that can be tapped for spending thanks to rapidly appreciating value.
"A major pullback in consumer spending could get ugly very quickly," he said.

Click on graph for larger image.
This graph shows the price of Los Angeles housing based on the OFHEO housing index. For the real price, the nominal price is adjusted by CPI, less Shelter, from the BLS.
Although I agree prices will probably not fall 10%+ per year, I think the bust will last longer than 5 years and prices will fall steadily in real terms. In the previous California housing bust, prices declined for 6 1/2 years and the median house lost almost 34% in real terms.
Here is a chart of the year to year price declines in Los Angeles according OFHEO.
| Year of Housing Bust | Nominal Annual Price Decline | Cumulative Nominal Price Decline | Real Annual Price Decline | Cumulative Real Price Decline |
| 1 | -1.9% | -1.9% | -5.1% | -5.1% |
| 2 | -1.0% | -2.9% | -3.8% | -8.7% |
| 3 | -5.5% | -8.2% | -7.9% | -15.9% |
| 4 | -7.3% | -14.9% | -9.8% | -24.2% |
| 5 | -6.1% | -20.1% | -8.2% | -30.4% |
| 6 | +0.2% | -19.9% | -2.6% | -32.3% |
| 6.5 | -1.2% | -20.9% | -2.4% | -33.9% |
The worst annual declines occurred in the 3rd, 4th and 5th years of the housing bust.
Wednesday, July 19, 2006
MarketWatch: Bernanke overstates wage growth
by Calculated Risk on 7/19/2006 10:31:00 PM
Rex Nutting writes at MarketWatch: Bernanke overstates wage growth
Fed Chairman Ben Bernanke told senators Wednesday that he sees "some evidence" that wages are finally beginning to catch up with productivity growth ... "It's been slow coming. I want to be clear about that," Bernanke said of wage growth.And on real compensation, Nutting correctly notes:
But the figures Bernanke used in his testimony were not accurate. At several points in his testimony, Bernanke overstated the growth of wages over the past few years.
...
To his credit, Bernanke told Sen. Elizabeth Dole, R-N.C., that the evidence for wages catching up "is not very overwhelming." He noted that "the average hourly earnings number is up about a percentage point this last year versus the previous year."
But even that underwhelming figure is wrong.
According to the Bureau of Labor Statistics, average hourly earnings are up about 3.9% in the past year. Once adjusted for the 4.3% rise in inflation, however, real average hourly earnings are down 0.5% in the past year. The wage figures cover about 80% of U.S. workers.
If you look at nonfarm business compensation per hour, you have real increases about 2.5% over the past few years," Bernanke said. "And if you look at real average hourly earnings, it's much closer to zero."Kudos to Nutting.
The first part of that is true, according to BLS statistics. Real compensation has risen 2.5% cumulatively in the past two years.
The second part of Bernanke's statement is misleading but also technically true: Real average hourly earnings are down 1.6% in the past two years, which is "much closer to zero" than 2.5%.
While real compensation has risen 2.5% in the past two years, productivity is up a cumulative 5.5% over that period.
By that measure, compensation is not catching up with productivity; it is still falling behind.
Bernanke and Disposable Personal Income
by Calculated Risk on 7/19/2006 03:46:00 PM
Professor Hamilton covers some of Chairman Bernanke's positive comments today: Bernanke's latest testimony
This sentence, from Dr. Bernanke's statement leapt off the page (as least for me):
"... favorable fundamentals, including relatively low unemployment and rising disposable incomes, should provide support for consumer spending."Rising disposable incomes?

Click on graph for larger image.
SOURCE: BEA Personal Income and Its Disposition, Monthly
One of my concerns has been that real disposable personal income has been fairly flat for the last 6 months. Consumers have increased their consumption, as measured by real PCE, by borrowing, not from any increase in real DPI.
Perhaps Chairman Bernanke believes that nominal disposable incomes will continue to rise at the about the current pace, even as inflation subsides, thereby increasing real disposable incomes. In that case, rising DPI "should provide support for consumer spending". Maybe.
DataQuick: Bay Area home sales continue to drop
by Calculated Risk on 7/19/2006 02:40:00 PM
DataQuick reports: Bay Area home sales continue to drop, prices reach new peak
Home sales in the Bay Area continued to slow last month as prices reached new highs. Prices increased at their slowest pace in more than three years ...
| Median Home Price | June-04 | June-05 | June-06 | Pct.Chg |
| Alameda | $489K | $581K | $593K | 2.1% |
| Contra Costa | $458K | $558K | $592K | 6.1% |
| Marin | $690K | $815K | $829K | 1.7% |
| Napa | $501K | $608K | $638K | 4.9% |
| San Francisco | $653K | $760K | $778K | 2.4% |
| San Mateo | $646K | $752K | $759K | 0.9% |
| Santa Clara | $549K | $645K | $684K | 6.0% |
| Solano | $358K | $449K | $482K | 7.3% |
| Sonoma | $449K | $557K | $587K | 5.4% |
| TOTAL Bay Area | $516K | $610K | $644K | 5.6% |
I added the June 2004 median prices to give a two year perspective on prices.
"The market is definitely slowing but can only be considered "slow" when compared to the hot market of 2004 and 2005. In reality, today's market is pretty normal and balanced, right between the grim times of 1993 to 1995 and the frenzies of 1999 and 2004-2005. The Bay Area's market is reaching the end of a real estate cycle, it looks like prices could flatten out sometime this fall. What happens after that is anyone's guess," said Marshall Prentice, DataQuick president.
| Homes Sold | June-04 | June-05 | June-06 | Pct.Chg |
| Alameda | 2,922 | 2,730 | 1,991 | -27.1% |
| Contra Costa | 2,772 | 2,640 | 1,900 | -28.0% |
| Marin | 544 | 454 | 435 | -4.2% |
| Napa | 233 | 209 | 189 | -9.6% |
| San Francisco | 847 | 723 | 652 | -9.8% |
| San Mateo | 1,122 | 917 | 765 | -16.6% |
| Santa Clara | 3,543 | 3,220 | 2,562 | -20.4% |
| Solano | 1,055 | 1,147 | 732 | -36.2% |
| Sonoma | 1,066 | 974 | 666 | -31.6% |
| TOTAL Bay Area | 14,104 | 13,014 | 9,892 | -24.0% |
Sales have been falling for two years in the Bay Area. Since DataQuick's President says what happens next is "anyone's guess" - I'll guess we will see falling prices later this year.
MBA: Mortgage Application Volume Declines
by Calculated Risk on 7/19/2006 10:42:00 AM
The Mortgage Bankers Association (MBA) reports: Mortgage Application Volume Declines
Click on graph for larger image.
The Market Composite Index, a measure of mortgage loan application volume, was 540.8, a decrease of 4.6 percent on a seasonally adjusted basis from 566.8 one week earlier. On an unadjusted basis, the Index increased 36.4 percent compared with the previous week but was down 31.3 percent compared with the same week one year earlier.Mortgage rates decreased:
The seasonally-adjusted Purchase Index decreased by 6.2 percent to 398.5 from 425.0 the previous week and the Refinance Index decreased by 1.6 percent to 1377.6 from 1400.5 one week earlier.
The average contract interest rate for 30-year fixed-rate mortgages decreased to 6.73 percent from 6.81 percent...Change in mortgage applications from one year ago (from Dow Jones):
The average contract interest rate for one-year ARMs decreased to 6.28 percent from 6.41 percent ...
| Total | -31.3% |
| Purchase | -17.8% |
| Refi | -47.4% |
| Fixed-Rate | -31.8% |
| ARM | -30.0% |
Purchase activity is off 17.8% compared to the same week last year. The MBA purchase index has been fairly flat for several months. I expect another drop in the seasonally adjusted purchase activity in the coming months.
Tuesday, July 18, 2006
Fed Funds Rate Predictions
by Calculated Risk on 7/18/2006 09:06:00 PM
Update: Check out Dr. Tim Duy's Fed Watch: Living on a Knife Edge
The Cleveland FED presents the Fed Funds Rate probabilities based on options on federal funds futures. For the next two meetings (August and September), the current probabilities are interesting:

Click on graph for larger image (new window).
For the August meeting, the highest probability is 5.50%; another 25 bps hike.

For the September meeting, the highest probability is 5.25%.
This implies either a pause at both meetings, or a rate increase in August followed by a rate decrease in September.
I think this is the first time in this cycle that we've seen the highest probability FED Funds rate be lower for the further out meeting.
DataQuick: SoCal Appreciation / Sales Weaken
by Calculated Risk on 7/18/2006 02:44:00 PM
DataQuick reports: Southland home prices set record, appreciation/sales weaken
Southern California home prices climbed to a new peak last month but at the slowest pace in more than six years. Prices edged higher even as June sales fell to a seven- year low, the result of higher borrowing costs, more inventory and less urgency among buyers.
| Median Home Price | June-04 | June-05 | June-06 | Pct.Chg |
| Los Angeles | $414K | $475K | $517K | 8.8% |
| Orange County | $540K | $603K | $646K | 7.1% |
| San Diego | $464K | $493K | 488K | -1.0% |
| Riverside | $319K | $393K | $422K | 7.4% |
| San Bernardino | $246K | $322K | $367K | 14.0% |
| Ventura | $500K | $584K | $627K | 7.4% |
| TOTAL SoCal | $406K | $465K | $493K | 6.0% |
I added the June 2004 median prices to give a two year perspective on prices.
DataQuick addessed the apparently price puzzle with rising inventories and falling sales:
"Many view this as a great conundrum: Prices continue to rise, even set records, as sales continue to slow. It happened for two years in San Diego before prices last month finally fell slightly below year-ago levels. We view this as the normal winding down of a real estate cycle, where declining demand gradually erodes price growth until it halts or reverses. We expect more markets to see prices flatten or decline a bit in the second half of this year," said Marshall Prentice, DataQuick president.
| Homes Sold | June-04 | June-05 | June-06 | Pct.Chg |
| Los Angeles | 11,673 | 12,001 | 10,248 | -14.6% |
| Orange County | 4,749 | 4,898 | 3,608 | -26.3% |
| San Diego | 6,208 | 5,663 | 4,301 | -24.1% |
| Riverside | 6,343 | 6,485 | 5.927 | -8.6% |
| San Bernardino | 4,292 | 4,700 | 3.998 | -14.9% |
| Ventura | 1,466 | 1,707 | 1,155 | -32.3% |
| TOTAL SoCal | 34,731 | 35,454 | 29,237 | -17.5% |
Notice that San Diego had declining sales in 2005 compared to 2004. As LA Times writer David Streitfeld noted about the San Diego housing market:
San Diego had the wildest run-up among major California cities, with prices tripling since the mid-1990s. ... The market also began to fade first in San Diego. ...It does appear that San Diego is leading the way, and I think that means declining prices soon in all of SoCal.
Whatever happens [in San Diego], optimists and pessimists agree, will happen later in the rest of the state.
NAHB: Builder Confidence Slips Again In July
by Calculated Risk on 7/18/2006 01:23:00 PM
The National Association of Home Builders reports: Builder Confidence Slips Again In July 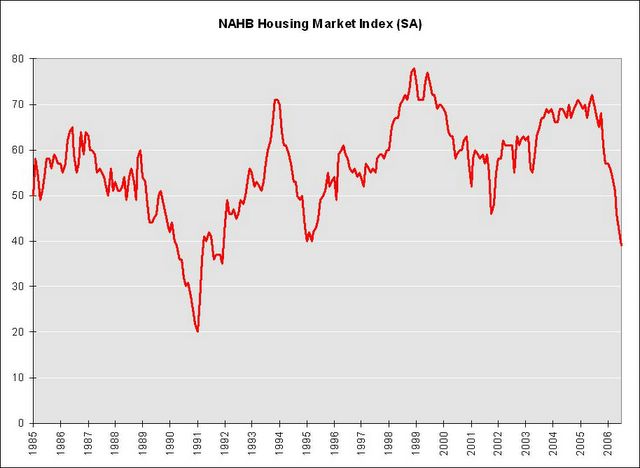
Click on graph for larger image.
Increased concerns about interest rates and housing affordability caused builder confidence in the market for new single-family homes to slip three more notches to 39, according to the National Association of Home Builders/Wells Fargo Housing Market Index (HMI) for July, reported today.
“The HMI is down from its most recent cyclical high of 72 in June of last year, and reflects growing builder uncertainly on the heels of reduced sales and increased cancellations related to eroding affordability as well as an ongoing withdrawal of investors/speculators from the marketplace,” said NAHB Chief Economist David Seiders.
“But just as concerning to many builders is the potential for more monetary tightening by the Federal Reserve that could drive interest rates, and thereby homeownership costs, even higher. Ironically, the Fed’s inflation-fighting moves have helped firm up the rental market and raise the ‘owners’ equivalent rent’ components of the core inflation measures that the Fed is seeking to contain,” Seiders added.
...
All three component indexes fell in July. The largest decline was in the index gauging sales expectations for the next six months, which fell five points to 46. The index gauging current sales of new single-family homes fell four points to 43 and the index gauging traffic of prospective buyers fell two points to 27.
Builders in the West region, who have been the most optimistic in the HMI for some time, recorded the biggest dip in confidence this time around, with a nine-point decline to 51. Builders in the Northeast posted a five-point decline to 36, and builders in the Midwest posted a four-point decline to 21. The HMI for the large South region edged up two points to 50, although this measure still is down considerably from a cyclical high of 77 in June of last year.
“In terms of historical comparison, the HMI’s movement is essentially in line with readings from the 1994-95 period when the Federal Reserve tightened monetary policy and a fairly orderly cooling-down process occurred in the nation’s housing markets,” Seiders observed. “That is what our forecasts anticipate happening in the current period, provided the downside risks of rising interest rates and a bail-out by investors/speculators do not become too pronounced.
With respect to interest rates, we expect the Federal Reserve to maintain the current 5.25 percent target for the federal funds rate for some time, and we’re projecting only modest increases in long-term interest rates from current levels.”
Here is a chart of the various components of the index.
The Housing Market Index cotinues to fall and is now at the lowest level since 1991.
Monday, July 17, 2006
Housing: Skies Not Sunny in San Diego
by Calculated Risk on 7/17/2006 03:26:00 AM
David Streitfeld writes in the LA Times: For San Diego Real Estate, the Skies Are Not So Sunny. Excerpts:
San Diego had the wildest run-up among major California cities, with prices tripling since the mid-1990s. ... The market also began to fade first in San Diego. ...Streitfeld relates some positive comments from a local real estate broker and then notes:
Whatever happens here, optimists and pessimists agree, will happen later in the rest of the state.
That's about the only thing everyone agrees on. The size of the coming hangover is a particularly contentious matter.
Most analysts and people in the real estate industry insist it will be mild. The housing bears say the bulls are either misguided, uninformed or shills.
... the fliers taped to the window outside the office door tell a different story. "Huge Price Reduction," one says. Another says both "Reduced" and "$15,000 Credit."I believe this is just the beginning.
In some cases, the prices are dropping faster than the fliers can be reprinted.
A two-bedroom town home has its price of $324,900 crossed out with a marking pen, replaced by $309,900. Another house, a four-bedroom in suburban La Mesa, has a printed price of $575,000.
Below that is handwritten $549,000.
Scribbled below that is a new minimum: $499,000.
Sunday, July 16, 2006
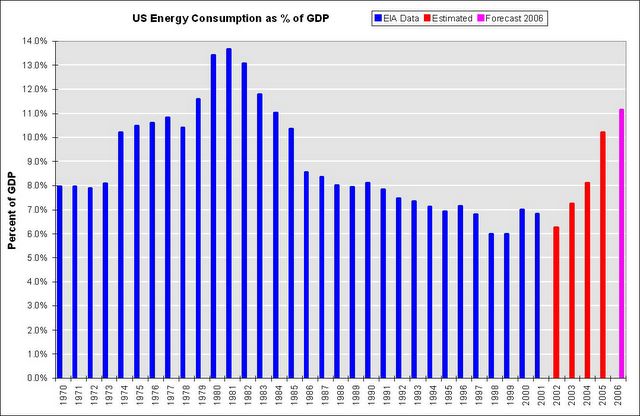
Energy Consumption as Percent of GDP
by Calculated Risk on 7/16/2006 08:31:00 PM
From this Christian Science Monitor article: Oil spike: a surmountable challenge?
... back in 1981, energy was a much larger part of the US economy, representing 14 percent of the gross domestic product, Wyss says. Because energy was so crucial back then, the Federal Reserve pushed interest rates sharply higher to curtail inflation.I've heard this statement before on CNBC several times. Is energy consumption really only 7% of GDP?
Today, energy represents 7 percent of GDP. "The Fed will not have to jerk interest rates up," says Wyss. "We are in better shape."
First, I checked with the EIA: Table 1.5 Energy Consumption, Expenditures. Sure enough, for the last 2 years reported, energy consumption was 7% and 6.8% of GDP. Of course those were for the years 2000 and 2001, respectively.
Energy prices have increased significantly faster than GDP over the last 5 years. Sure enough, it appears Mr. Wyss is using old numbers.
Click on graph for larger image.
Using a combination of EIA numbers for energy sources, and BLS numbers for price changes, and holding consumption steady (very conservative), this graph shows that US Energy Consumption is around 11.2% of GDP right now. (UPDATE NOTE: I'll try to do a more comprehensive calculation later this week - with links and my calculations. this was a rough estimate)
As an aside, ignore Mr. Wyss' comments on the FED. The FED looks primarily at core inflation rates (like Core CPI and PCE). Alhtough the FED is concerned about higher energy prices feeding through to core inflation rates, they aren't really focused directly on energy prices.
On energy issues, see Dr. Hamilton's: Can the economy shrug off $80 oil?
Saturday, July 15, 2006
Retail Employment
by Calculated Risk on 7/15/2006 07:00:00 PM
Danielle DiMartino writes: Retailers' actions point to recession
... we already know, from last week's labor report, that retailers were compelled to cut payrolls for a third consecutive month in June.Is this decline in retail employment 'unprecedented outside of recessions'?
"More strikingly," Goldman Sachs chief economist Jan Hatzius wrote, "the year-on-year growth rate has plummeted from 1.3 percent in 2005 to -0.2 percent as of June 2006. Year-on-year declines in retail employment are unprecedented outside of recessions."

Click on graph for larger image.
Shaded areas are recessions according to NBER.
It appears that Hatzius is correct. But is it different this time? Maybe, with the rapid expansion of internet shopping, the model of retail has changed.
Or, as DiMartino apparently believes, the retailers are the first to detect the coming recession. She relates the decrease in retail employment to the slowdown in the housing market:
During the housing boom, home-equity withdrawals were a big contributor to consumers' ability to spend.
But in the first half of 2006, nearly 90 percent of refinancings were cash-outs, up from 20 percent in 2003.
In other words, it used to be that people refinanced their homes to lower their payments. Today almost all go through the exercise just to unlock cash.
...
It stands to reason that retailers would be the first to detect the diminution of this source of disposable income, which is at least partially to blame for the 86,000 jobs the sector has shed in the last three months.
"Retailers may have decided that the recent weakness in personal consumption will persist," Mr. Hatzius added.
Of course, the spin doctors are sure to dismiss the negative growth in retail employment. Sure, every time it's happened since 1945 it's presaged a recession. But it's bound to be different this time. Of course.
Friday, July 14, 2006
Volcker: Bernanke Faces Tougher Task Than Volcker
by Calculated Risk on 7/14/2006 03:07:00 PM
From Bloomberg:
Paul Volcker, who took over the Federal Reserve a generation ago at a time of soaring prices and stagnant growth, said the current central bank chief, Ben S. Bernanke, faces an even tougher challenge.Clearly the economy is better today than in 1979. However the imbalances are much worse, and fiscal / public policy has been a disaster. I agree that Bernanke has the more difficult task.
``It was easier for me,'' Volcker, 78, said in an interview to be broadcast this weekend on ``Political Capital With Al Hunt,'' a Bloomberg television program. ``While the economic situation was much worse, it was easier to act because it was clear what the enemy was.''
Volcker, appointed by President Jimmy Carter in 1979, is credited with defeating inflation, which was 13 percent when he took the Fed's helm. Volcker raised the benchmark interest rate to a record, helping send the economy into recession.
While he said the global economy is doing well, Volcker voiced concern that the good times can't last.
``We are skating along quite nicely,'' said Volcker, though ``the ice is not as thick as I would like it to be.''
The U.S. current-account deficit exceeded $208 billion in the first quarter. The figure, which includes trade as well as transfer payments and investment income, declined from $223 billion the previous quarter. It was still the second-largest on record and requires the U.S. to attract $2.3 billion in foreign capital each day fund the gap.
``We are consuming too much and investing too little,'' said Volcker, who also indicated that higher taxes may be needed to narrow the budget deficit.
...
``Revenues have gotten too low'' relative to what the government wants to spend, Volcker said.
Because of U.S. dependence on foreign capital to fund trade and budget gaps, ``it is critical that we maintain confidence in our currency,'' said Volcker.
U.S. retail sales fall 0.l% in June
by Calculated Risk on 7/14/2006 08:46:00 AM
From Rex Nutting at MarketWatch: U.S. retail sales fall 0.l% in June
U.S. consumers cut back in June, sending retail sales down 0.1% for the month, the Commerce Department reported Friday. It was the second straight month of tepid retail sales. Sales rose 0.1% in May.Here is the report.
Percent Change in Retail and Food Services Sales

Click on graph for larger image.
The other shoe? Housing and equity extraction slowdown. Then retail sales slows?
Thursday, July 13, 2006
Budget Improvement?
by Calculated Risk on 7/13/2006 03:01:00 PM
The Treasury Department released the Monthly Treasury Statement for June today. See Table 2: On Budget Surplus / Deficit
For fiscal year-to-date, the budget deficit is $374.3 Billion compared to $410.1 Billion for fiscal 2005. That is the "extraordinary" improvement announced by the White House.
Meanwhile the YTD annual increase in the National Debt is larger in fiscal 2006 than 2005 - so even the small improvement in the budget deficit is possibly an accounting illusion.
Bottom line: There has been little or no improvement in the budget deficit.
UPDATE: pgl reminds me: Repatriation Relief and that “Surge” in Tax Revenues
So as the Bush Administration crows about the “surge” in taxes, let’s just remember that this is yet another example of Enron accounting where in reality the government gave away $50 billion on net.I suspect even the minor improvment will be transitory. Not only is the repatriation give away over, but "not withheld" taxes will be negatively impacted next year by the housing and stock market performance in 2006.
Wednesday, July 12, 2006
Two Posts on Economy
by Calculated Risk on 7/12/2006 11:54:00 PM
Dr. Thoma has two excellent posts on the economy.
The first is the Dallas Fed's Economic Outlook.
The second is Selling the Economy.
The economy is clearly slowing, especially housing and consumer spending. I'd argue cause and effect: the slowing housing market is leading to less borrowing, and less consumer spending. I'm less confident in the Dallas Fed's views on inflation.
On consumer spending, ac provided a link to this BusinessWeek story in the comments: The Real Problem with Job Growth, U.S. retailers are no longer the job-creation engine they were, suggesting that consumers may finally be crying "uncle"
"We have to work hard to keep our labor and hiring in check given our outlook in same store sales," says Mike Marchetti, Finish Line's executive vice-president of store operations.
Around the country, retailers are echoing similar sentiments, and many are holding off on their hiring plans.
...
It's unusual that retailers are trimming their workforces when the rest of the economy is growing. For years, retailers have been the source of significant job creation in the U.S. During the 1990s, department stores, groceries, and other retailers added 2.3 million jobs, or an average of almost 20,000 a month, according to the Bureau of Labor Statistics.
Now, the concern is that retailers, who are positioned to detect the pulse of consumers more quickly than many other types of companies, are sensing trouble ahead. "Something is screamingly wrong with consumers, and retailers are reacting," says Richard Hastings, economic advisor to the Federation of Credit and Financial Professionals and a senior retail analyst at Bernard Sands, a retail credit rating firm.
The outlook for the U.S. economy, in its fifth year of expansion, is already weakening.

Click on graph for larger image.
From the Cleveland Fed: Fed Funds Rate Predictions
Even though the economy is clearly slowing, expectations are for another 25 bp rate hike in August.
San Diego: YoY Home Prices Decline
by Calculated Risk on 7/12/2006 04:58:00 PM
UPDATE: Also see VoiceofSanDiego: First Yearly Home Price Drop in a Decade. Excerpts:
Chris Thornberg a senior economist at the University of California, Los Angeles Anderson Forecast, said dropping home prices can have a powerful psychological effect on homeowners.The San Diego Union-Tribune reports: County housing market continues to soften
"When your house keeps appreciating by 10 or 20 percent a year, easier to buy that nicer bottle of wine, perhaps go out to that slightly fancier restaurant -- what the hell, right?" Thornberg said. "But when that goes flat, suddenly, oh geez, the house isn't going to be this big boom of new wealth. Boy, I'm going to have to be a bit more careful with my dollar."
San Diego County's housing market continued to lose steam in June, with median home prices posting their first year-over-year decline in a decade and sales dropping for the 24th straight month.There it is: a year-over-year price decline in San Diego. Also sales are down and inventory up.
...
Last month's median home price dropped to $488,000, a 1 percent decline from a year earlier and a 6 percent decrease from last November's peak of $518,000.
... sales increased slightly from May but were down 24 percent from June of 2005.They didn't mention how many homes were on the market in June 2005. The article has many positive comments, "a good time for the buyer to jump into the market" and "this is just part of a plateauing of prices", but I think the numbers tell the real story.
Yet another indicator of the county's flattening market is the growing supply of homes for sale. As of Wednesday, there are 22,460 homes on the market, according to Sandicor, the multiple listing service subscribed to by area real estate offices.
Science of Climate Change
by Calculated Risk on 7/12/2006 04:19:00 PM
I'd like to discuss policy proposals to address Global Warming on this blog, not the science of global warming. I am interested in the science, but I think too many posts on that subject will detract from economic issues.
I understand many readers are very interested in the science of climate change. That is wonderful. I recommend asking questions at RealClimate.org; "Climate science from climate scientists".
For my occasional off-topic posts, I'll stick to hiking / mountain climbing and, of course ...
Enjoy.
May Trade Deficit: $63.8 Billion
by Calculated Risk on 7/12/2006 11:08:00 AM
The Census Bureau reports:
The U.S. Census Bureau and the U.S. Bureau of Economic Analysis, through the Department of Commerce, announced today that total May exports of $118.7 billion and imports of $182.5 billion resulted in a goods and services deficit of $63.8 billion, $0.5 billion more than the $63.3 billion in April, revised. May exports were $2.7 billion more than April exports of $115.9 billion. May imports were $3.2 billion more than April imports of $179.3 billion.For an excellent analysis See Dr. Setser's: How long can non-oil imports remain flat if the US economy continues to grow?

Click on graph for larger image.
The non-Petroleum goods balance has stabilized since the end of last year. This might suggest that US economic growth is slowing. From a post in March:
"Interestingly, the change in U.S. home mortgage debt over the past half-century correlates significantly with our current account deficit. To be sure, correlation is not causation, and there have been many influences on both mortgage debt and the current account."
Alan Greenspan, Current account, Feb 4, 2005
I expect the annual increase in mortgage debt to decline in 2006. This is because I expect new and existing home purchases to decline, and homeowners to extract less equity from their homes in 2006.
The drop in mortgage activity is is one of the reasons I expect the trade deficit to stabilize in 2006.
MBA: Mortgage Application Volume Steady
by Calculated Risk on 7/12/2006 10:21:00 AM
The Mortgage Bankers Association (MBA) reports: Mortgage Application Volume Steady
Click on graph for larger image.
The Market Composite Index, a measure of mortgage loan application volume, was 566.8, an increase of 1.0 percent on a seasonally adjusted basis from 561.0 one week earlier. On an unadjusted basis, the Index decreased 29.1 percent compared with the previous week and was down 36.3 percent compared with the same week one year earlier.Mortgage rates increased slightly:
The seasonally-adjusted Purchase Index increased by 2.6 percent to 425.0 from 414.2 the previous week and the Refinance Index decreased by 1.6 percent to 1400.5 from 1423.9 one week earlier.
The average contract interest rate for 30-year fixed-rate mortgages increased to 6.81 percent from 6.80 percent ...Change in mortgage applications from one year ago (from Dow Jones):
The average contract interest rate for one-year ARMs increased to 6.41 percent from 6.39 percent ...
| Total | -36.3% |
| Purchase | -23.4% |
| Refi | -52.0% |
| Fixed-Rate | -37.0% |
| ARM | -34.5% |
Purchase activity is off 23.4% compared to the same week last year. The MBA Purchase Index is indicating that the housing market is continuing to slow compared to 2005.
Tuesday, July 11, 2006
The Press and the Budget Deficit
by Calculated Risk on 7/11/2006 06:24:00 PM
With the White House announcement today that the deficit will be smaller than they expected, it is worth looking at how the story is being reported.
Joel Havemann, at the LA Times, does a solid job: Bush Credits Tax Cuts for Deficit Shrinkage
President Bush today delivered what he called "some good news for the American taxpayer" — a budget update that shows the deficit for this year shrinking from the $423 billion forecast five months ago to $296 billion now.Notice how Havemann correctly notes this is an improvement in the "forecast". The Bush Administration routinely overestimates the deficit and then touts their "improvement". Havemann offers the opposing view:
Rep. John Spratt of South Carolina, the top Democrat on the House Budget Committee, pointed out that when Bush came into office in January 2001, the official White House budget projection showed a $305-billion surplus. So the new projected deficit of $296 billion represents a swing of $600 billion, Spratt said.Although I'd prefer a comparison of the General Fund deficit for '01 and '06 (it would be a larger swing since annual Social Security revenues have been increasing), this still shows the damage done to the US fiscal position by the Bush tax cuts.
And Havemann pulls up some old Bush projections:
In 2002, the White House estimated that revenues would reach $2.5 trillion in 2006 under the tax laws then in effect. The revenue re-estimate issued today was $2.4 trillion. ...Spending in 2006 was projected in 2002, based on laws then in effect, to reach about $2.2 trillion; it is now estimated at $2.7 trillion.Well done. An excellent article.
From the WaPo: Budget Deficit Estimate Drops to $296B. After quoting Mr. Bush, the article offers the opposite view:
Congressional Democrats blasted Bush's speech, saying that the deficit remains too large and charging that the administration put out a gloomy early forecast in order to claim better-than-expected results later on.And they properly note:
... the White House acknowledges that in the long run, the nation's fiscal outlook remains bleak. ... "The projections are that the Social Security surplus will peak in 2010, and diminish every year thereafter, so ultimately, instead of collecting 5 cents on the national dollar and paying out 4 1/2 cents, we will continue to collect 5 cents and pay out 7 cents," [Douglas Holtz-Eakin, a former CBO director and Bush White House economist.] said. "And that's the good news. The bad news is Medicare. The demands on the Treasury go from 4 cents on the national dollar to 22 cents in the next 50 years."The outlook is bleak, primarily because of General Fund issues: the structural General Fund deficit and Medicare. In comparison, Social Security is a minor problem. But at least the former Bush economist is being honest about the outlook: bleak.
The WaPo also notes some of the reasons for the improvement:
Among the fastest-growing types of revenue were corporate income taxes, which rose 26 percent in the nine months ending June 30, according to the CBO. ... Another major source of revenue growth were taxes that are not withheld from paychecks, typically capital gains and year-end bonuses for Wall Streeters and other upper-income people. Revenue from those types of taxes has risen 20 percent, compared with 8 percent for taxes withheld from the paychecks of salaried employees.Since the authors are discussing the Unified Budget deficit, they should note that the annual Social Security surplus has been increasing significantly, contributing to the improvement. They should also note the improvement in the legally mandated budget deficit (the General Fund) has been minor.
The bad news is profit growth appears to be slowing, and the housing bubble is starting to unwind (impacting not withheld tax revenues next year). In my yearly projections, I noted: "Although I expect the General Fund deficit to grow to around $600 Billion in 2006, I don't think it will become a huge story until '07 or '08." My reasoning was the impact of a slowing economy would impact next year's corporate profits and 'not withheld' tax revenues.
Overall these stories are pretty good. I'd prefer switching to the General Fund (as required by law), but that is going to take some work.


