by Calculated Risk on 7/20/2006 01:32:00 AM
Thursday, July 20, 2006
Thornberg: Housing a "Classic Bubble"
UCLA Economist Christopher Thornberg is quoted in the San Bernardino Sun: Region's home sales looking like 'classic bubble'
"The soft-landing people are full of nonsense," said Christopher Thornberg, senior economist at UCLA. "This is a classic bubble. And unit sales are falling faster than in past bubbles."I think Thornberg is optimistic.
"We are in the middle of this decline. If we are lucky, prices will go flat. But we are not going to have prices fall like the stock market. You won't see declines of 10 percent or 15 percent per year. What will happen is that prices will flatten out," he said, adding that there might not be housing appreciation until 2011.
Next year will be critical from the standpoint of how the consumer will react to not having "a house cash machine" that can be tapped for spending thanks to rapidly appreciating value.
"A major pullback in consumer spending could get ugly very quickly," he said.

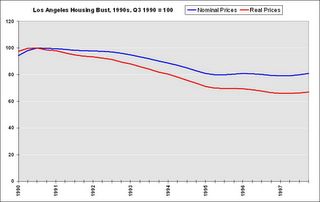
Click on graph for larger image.
This graph shows the price of Los Angeles housing based on the OFHEO housing index. For the real price, the nominal price is adjusted by CPI, less Shelter, from the BLS.
Although I agree prices will probably not fall 10%+ per year, I think the bust will last longer than 5 years and prices will fall steadily in real terms. In the previous California housing bust, prices declined for 6 1/2 years and the median house lost almost 34% in real terms.
Here is a chart of the year to year price declines in Los Angeles according OFHEO.
| Year of Housing Bust | Nominal Annual Price Decline | Cumulative Nominal Price Decline | Real Annual Price Decline | Cumulative Real Price Decline |
| 1 | -1.9% | -1.9% | -5.1% | -5.1% |
| 2 | -1.0% | -2.9% | -3.8% | -8.7% |
| 3 | -5.5% | -8.2% | -7.9% | -15.9% |
| 4 | -7.3% | -14.9% | -9.8% | -24.2% |
| 5 | -6.1% | -20.1% | -8.2% | -30.4% |
| 6 | +0.2% | -19.9% | -2.6% | -32.3% |
| 6.5 | -1.2% | -20.9% | -2.4% | -33.9% |
The worst annual declines occurred in the 3rd, 4th and 5th years of the housing bust.


