 RSS Feed
 by Calculated Risk on 6/10/2005 02:23:00 AM
Friday, June 10, 2005
US Trade Deficit: $57 Billion for April
The U.S. Census Bureau and the U.S. Bureau of Economic Analysis released the monthly trade balance report today for April:
"... total April exports of $106.4 billion and imports of $163.4 billion resulted in a goods and services deficit of $57.0 billion, $3.4 billion more than the $53.6 billion in March, revised.Note: all numbers are seasonally adjusted.
April exports were $3.1 billion more than March exports of $103.4 billion.
April imports were $6.5 billion more than March imports of $156.9 billion."

Click on graph for larger image.
This graph shows the monthly trade balances for 2003, 2004 and 2005 and depicts the worsening year over year trade imbalance. The April trade deficit worsened as exports increased $3.1 Billion and imports increased $6.5 Billion.
The recent increase in oil prices had an impact on the April trade deficit. The average contract price for oil jumped from $41.14 in March to $44.76 in April. This is a new record for the import contract price, exceeding the old record of $41.79 set in October.
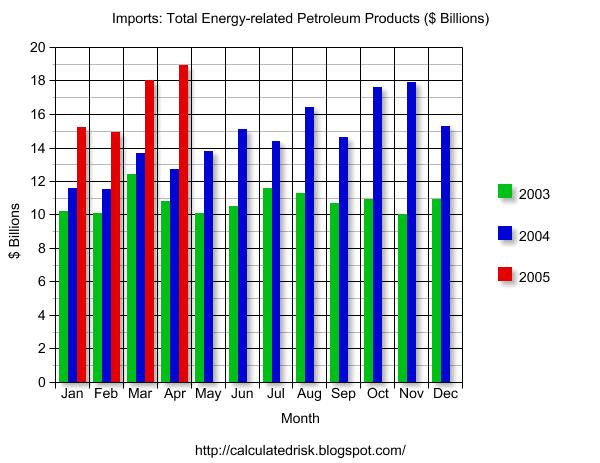
This graph shows total petroleum imports (NSA) per month for 2003, 2004 and the first four months of 2005. Petroleum imports were about 30% of the trade deficit or about 1.5% of GDP. Even without petroleum imports, the trade deficit would be close to 4% of GDP - a serious problem.
April is the 4th largest trade deficit ever. The trade deficit has been over $50 billion 11 times - the last 11 months in a row.


