by Calculated Risk on 10/19/2011 11:07:00 AM
Wednesday, October 19, 2011
AIA: Architecture Billings Index declined in September
Note: This index is a leading indicator for new Commercial Real Estate (CRE) investment.
From AIA: Another Drop for Architecture Billings Index
Following the first positive score in four months, the Architecture Billings Index (ABI) reversed direction again in September. ... The American Institute of Architects (AIA) reported the September ABI score was 46.9, following a score of 51.4 in August. This score reflects a sharp decrease in demand for design services (any score above 50 indicates an increase in billings). The new projects inquiry index was 54.3, down from a reading of 56.9 the previous month.
“It appears that the positive conditions seen last month were more of an aberration,” said AIA Chief Economist, Kermit Baker, PhD, Hon. AIA. “The economy is weak enough at present that design activity is bouncing around more than usual; one strong month can be followed by a weak one. The economy needs to be stronger to generate sustained growth in design activity.”
 Click on graph for larger image in graph gallery.
This graph shows the Architecture Billings Index since 1996. The index declined to 46.9 in September from 51.4 in August. Anything below 50 indicates contraction in demand for architects' services.
Note: This includes commercial and industrial facilities like hotels and office buildings, multi-family residential, as well as schools, hospitals and other institutions.
According to the AIA, there is an "approximate nine to twelve month lag time between architecture billings and construction spending" on non-residential construction. So the recent contraction suggests further declines in CRE investment in 2012.
2012 Social Security Cost-Of-Living Adjustment approximately 3.6% increase
by Calculated Risk on 10/19/2011 09:40:00 AM
I'll have more on prices later ...
The BLS reported this morning: "The Consumer Price Index for Urban Wage Earners and Clerical Workers (CPI-W) increased 4.4 percent over the last 12 months to an index level of 223.688 (1982-84=100)."
CPI-W is the index that is used to calculate the Cost-Of-Living Adjustments (COLA). Here is an explanation:
The calculation dates have changed over time (see Cost-of-Living Adjustments), but the current calculation uses the average CPI-W for the three months in Q3 (July, August, September) and compares to the average for the highest previous average of Q3 months. Note: this is not the headline CPI-U, and not seasonally adjusted.
 Click on graph for larger image in graph gallery.
This graph shows CPI-W since January 2000. The red lines are the Q3 average of CPI-W for each year.
• In 2008, the Q3 average of CPI-W was 215.495. In the previous year, 2007, the average in Q3 of CPI-W was 203.596. That gave an increase of 5.8% for COLA for 2009.
• In 2009, the Q3 average of CPI-W was 211.013. That was a decline of 2.1% from 2008, however, by law, the adjustment is never negative so the benefits remained the same in 2010.
• In 2010, the Q3 average of CPI-W was 214.136. That was an increase of 1.5% from 2009, however the average was still below the Q3 average in 2008, so the adjustment was zero.
• In 2011, the Q3 average of CPI-W was 223.233. This is above the Q3 2008 average, and COLA will increase around 3.6% for next year (the current 223.233 divided by the Q3 2008 level of 215.495).
Of course medicare premiums will increase too.
Contribution and Benefit Base
Since COLA increased, the contribution base will be adjusted using the National Average Wage Index.
This is based on a one year lag. Since there was no increase in COLA for the last two years, the contribution base has remained at $106,800 for three years. Since COLA will be positive this year, the adjustment this year will use the 2010 National Average Wage Index compared to the 2007 Wage Index. The National Average Wage Index for 2010 was $41,673.83 and the index for 2007 was $40,405.48. So $41,673.83 divided by $40,405.48 multiplied by $106,800 is approximately $110,000.
So the contribution base will increase to around $110,000 in 2012.
NOTE on CPI-chained: There has been some discussion of switching from CPI-W to CPI-chained for COLA. This will not happen this year, but could impact future Cost-of-living adjustments, see: Cost of Living and CPI-Chained
Housing Starts increased in September
by Calculated Risk on 10/19/2011 08:30:00 AM
From the Census Bureau: Permits, Starts and Completions
Housing Starts:
Privately-owned housing starts in September were at a seasonally adjusted annual rate of 658,000. This is 15.0 percent (±13.7%) above the revised August estimate of 572,000 and is 10.2 percent (±13.3%)* above the September 2010 rate of 597,000.
Single-family housing starts in September were at a rate of 425,000; this is 1.7 percent (±9.4%)* above the revised August figure of 418,000. The September rate for units in buildings with five units or more was 227,000.
Building Permits:
Privately-owned housing units authorized by building permits in September were at a seasonally adjusted annual rate of 594,000. This is 5.0 percent (±1.3%) below the revised August rate of 625,000, but is 5.7 percent (±2.6%) above the September 2010 estimate of 562,000.
Single-family authorizations in September were at a rate of 417,000; this is 0.2 percent (±1.0%)* below the revised August figure of 418,000. Authorizations of units in buildings with five units or more were at a rate of 158,000 in September.
 Click on graph for larger image in graph gallery.
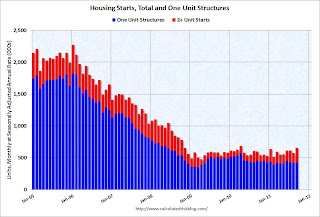
Total housing starts were at 658 thousand (SAAR) in September, up 15.0% from the revised August rate of 572 thousand. Most of the increase was for multi-family starts.
Single-family starts increased 1.7% to 425 thousand in September.
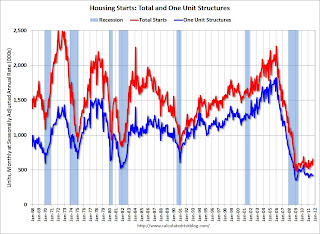
The second graph shows total and single unit starts since 1968.
 This shows the huge collapse following the housing bubble, and that housing starts have been mostly moving sideways for about two years and a half years - with slight ups and downs due to the home buyer tax credit.
Multi-family starts are increasing in 2011 - although from a very low level. This was well above expectations of 590 thousand starts in September.
Single family starts are still "moving sideways".
MBA: Mortgage Purchase Application Index at Lowest Level Since 1996
by Calculated Risk on 10/19/2011 07:25:00 AM
The MBA reports: Mortgage Applications Increase in Latest MBA Weekly Survey
The Refinance Index decreased 16.6 percent from the previous week. The seasonally adjusted Purchase Index decreased 8.8 percent from one week earlier and is at the lowest level in the survey since December 1996.The following graph shows the MBA Purchase Index and four week moving average since 1990.
...
The average contract interest rate for 30-year fixed-rate mortgages with conforming loan balances ($417,500 or less) increased to 4.33 percent from 4.25 percent, with points increasing to 0.48 from 0.47(including the origination fee) for 80 percent loan-to-value (LTV) ratio loans. ...
The average contract interest rate for 30-year fixed-rate mortgages with jumbo loan balances (greater than $417,500) increased to 4.64 percent from 4.59 percent, with points decreasing to 0.45 from 0.49 (including the origination fee) for 80 percent loan-to-value (LTV) ratio loans.
 Click on graph for larger image in graph gallery.
This was a sharp decrease in the purchase index, and the index is now at the lowest level since December 1996. This does not include cash buyers, but this suggests weaker home sales in November and December.
Tuesday, October 18, 2011
Countdown to Euroday Oct 23rd: Another wild day
by Calculated Risk on 10/18/2011 10:38:00 PM
Another wild day in Euroland ...
Early today, the Guardian reported: France and Germany ready to agree €2tn euro rescue fund
But later in the day, right before the close, Dow Jones reported: EU Source: No EFSF Deal Til Friday, EUR2 Trillion Number 'Simplistic'
European officials are still debating the size of the bailout fund for the euro zone and reports that an agreement has been reached to leverage it to EUR2 trillion are "totally wrong," an official familiar with the negotiations said.There are discussions concern insuring debt so the EFSF would take the first losses. If the first 20% was insured, the €440 billion EFSF could insure close to €2tn in debt - except it isn't that simple. First, the EFSF only has about €300 that can be deployed, and second, the amount of insurance will vary by country. So the €2tn was "simplistic".
Also Moody's downgraded Spain. From Bloomberg: Spain’s Rating Cut to A1 by Moody’s
Moody’s yesterday reduced its ranking to its fifth-highest investment grade, cutting it by two levels to A1 from Aa2, with the outlook remaining negative. ... Moody’s, in a statement, cited the “continued vulnerability of Spain to market stress” that is driving up the cost of borrowing, as well as weaker growth prospects.And from the NY Times: France Defends Its Credit Rating After Moody’s Warning
The discussions have taken on greater urgency since Moody’s warned late Monday of a possible downgrade to France’s flawless credit rating.And from the Financial Times: French warning to euro summit
President Nicolas Sarkozy said that “an unprecedented financial crisis will lead us to take important, very important decisions in the coming days”.The clock is ticking and the rumors are flying.
Raising the sense of urgency, the French president added: “Allowing the destruction of the euro is to take the risk of the destruction of Europe. Those who destroy Europe and the euro will bear responsiblity for resurgence of conflict and division on our continent.”
excerpt with permission


